As XRP looks to break out of a multi-week bullish flag pattern, market watchers remain optimistic, with prominent chartist EGRAG projecting an ultimate rally to $27.
XRP’s price movements have been bearish since soaring to $0.73 on Nov. 6. The asset rallied to $0.7487 on Nov. 13 following the reports of the fake BlackRock iShares XRP ETF. However, this surge was momentary, as XRP eventually returned to its downtrend.
XRP Forms Flag Pattern
Interestingly, this downtrend might be a bullish indicator of what’s to come. Due to its slope, market analysts have interpreted the trend as a downward consolidation, which emerged after the explosive 62% rally from $0.45 on Oct. 9 to $0.73 on Nov. 6.
Notably, the consolidation has resulted in forming a bullish flag pattern. For the uninitiated, a bullish flag pattern is a continuation pattern, representing a brief consolidation or pause in an uptrend before the price resumes its upward movement.
– Advertisement –
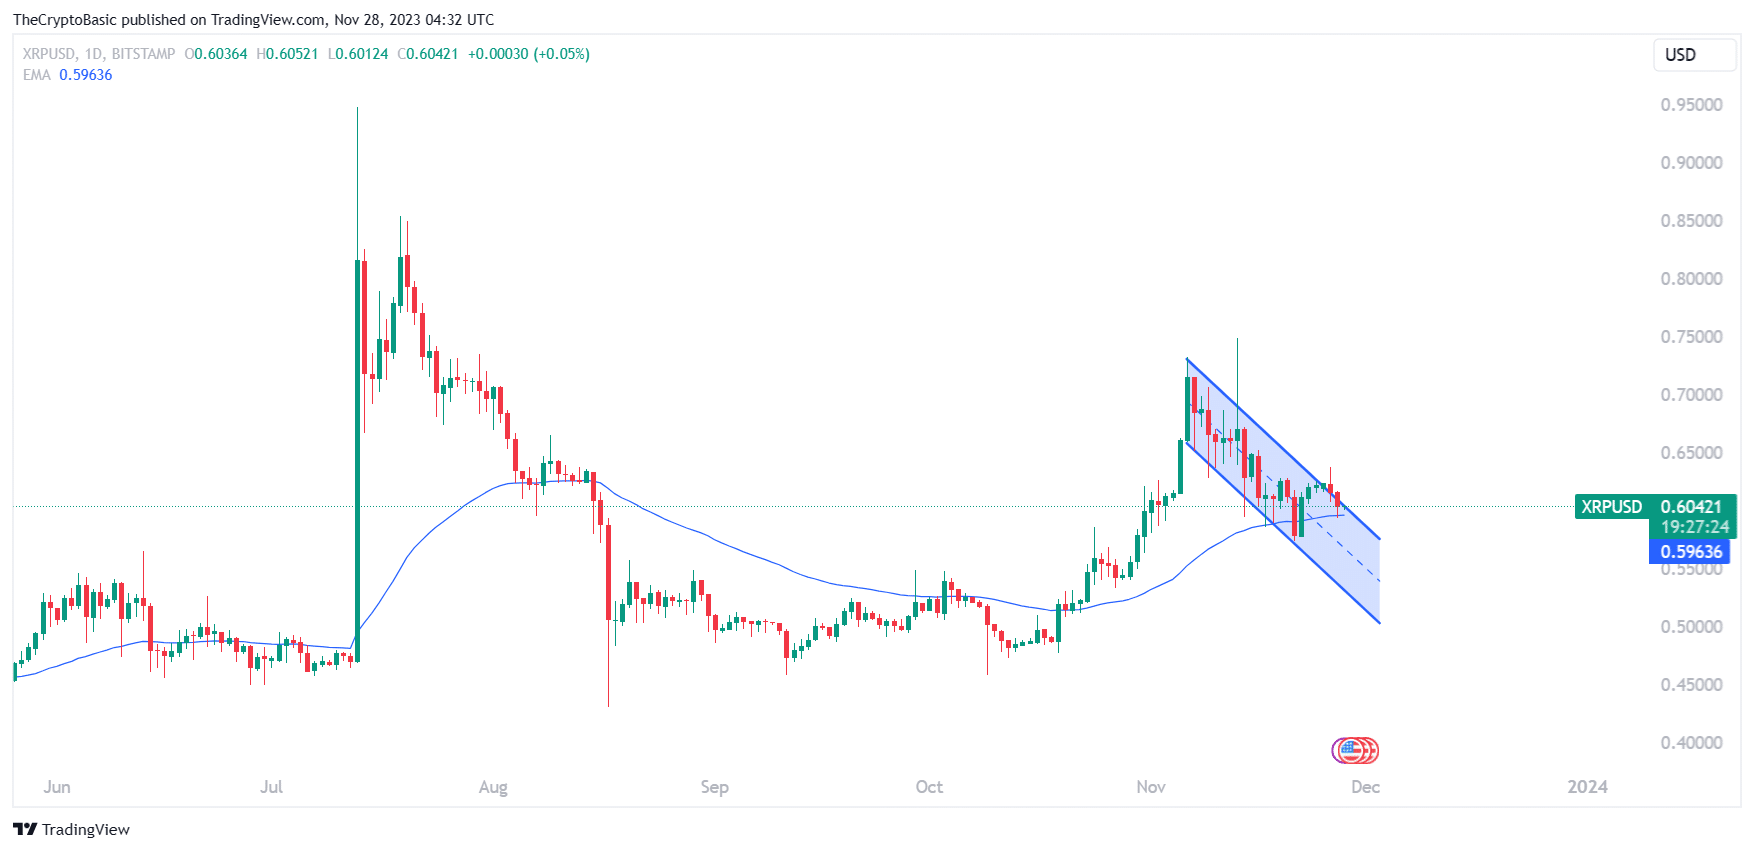
Interestingly, XRP appears to be heading towards a breakout of the flag. A breakout typically signals an end to the uptrend’s consolidation and resumption. XRP surged above the channel on Nov. 26 following a run to $0.6375. However, it faced resistance that brought it back into the flag.
XRP made another attempt yesterday, but it faced a similar opposition. This trend is expected to result in a retest of strong support levels within the flag before a pivotal breakout. Yesterday, XRP dropped to $0.5940, retesting the support at the 50-day EMA ($0.5960).
XRP to Target $27 Amid Bullish Indicators
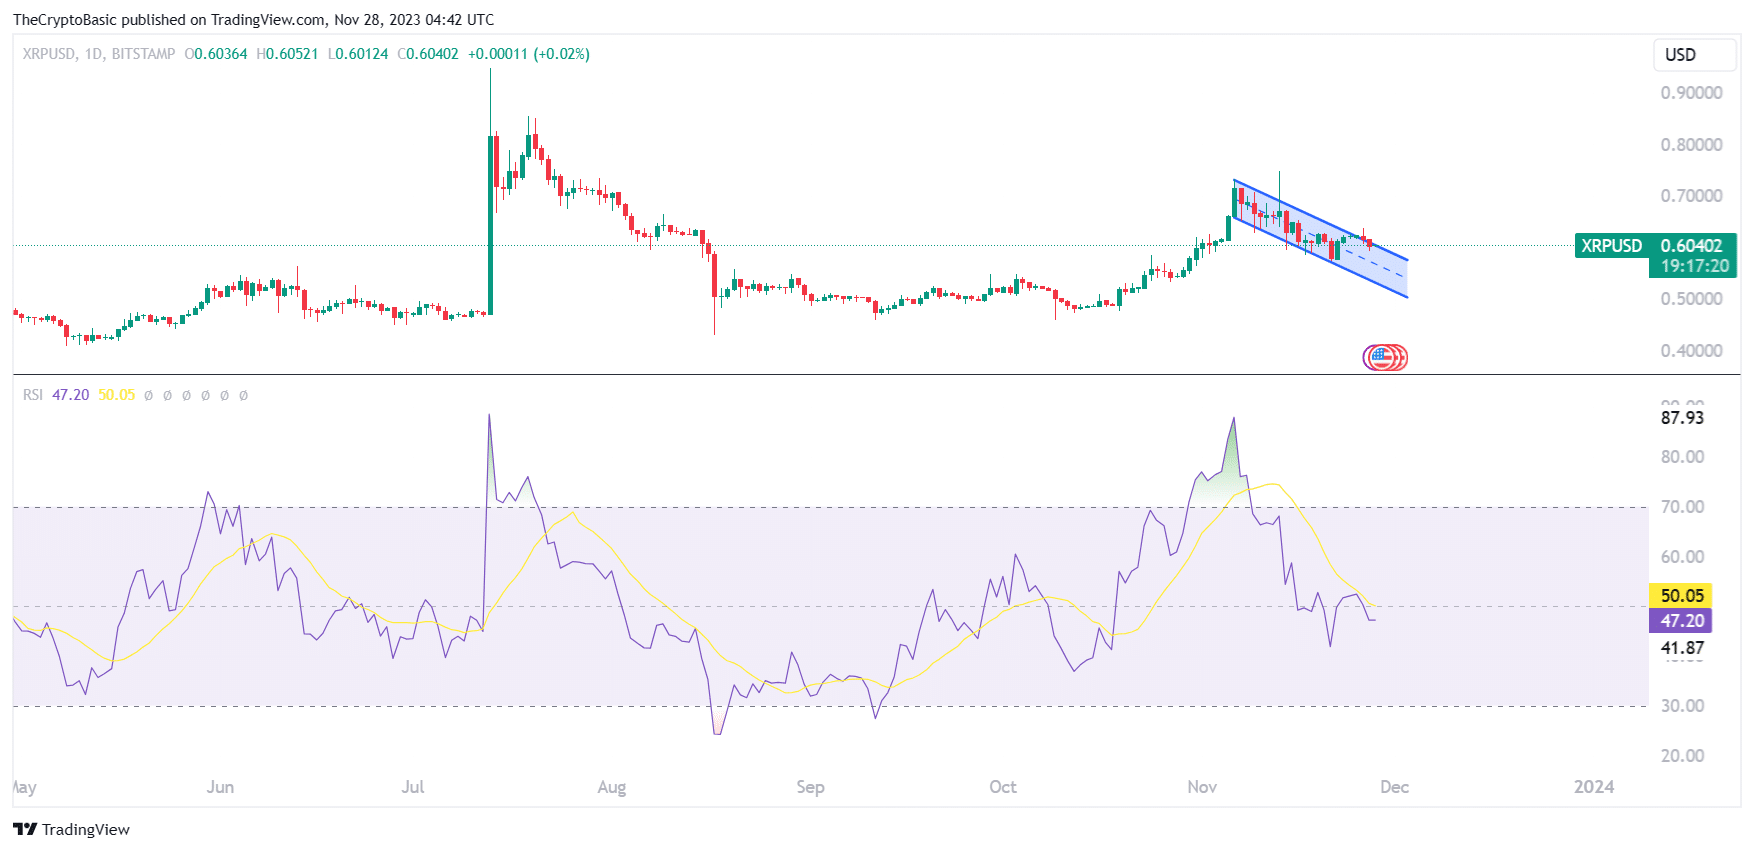
Another indication of a looming uptrend is the Relative Strength Index (RSI). The daily RSI currently sits at 47.20, finding stability after a period of downward movements. This pattern suggests that the selling pressure has eased, and the market might be finding a balance. However, it doesn’t necessarily imply an immediate reversal.
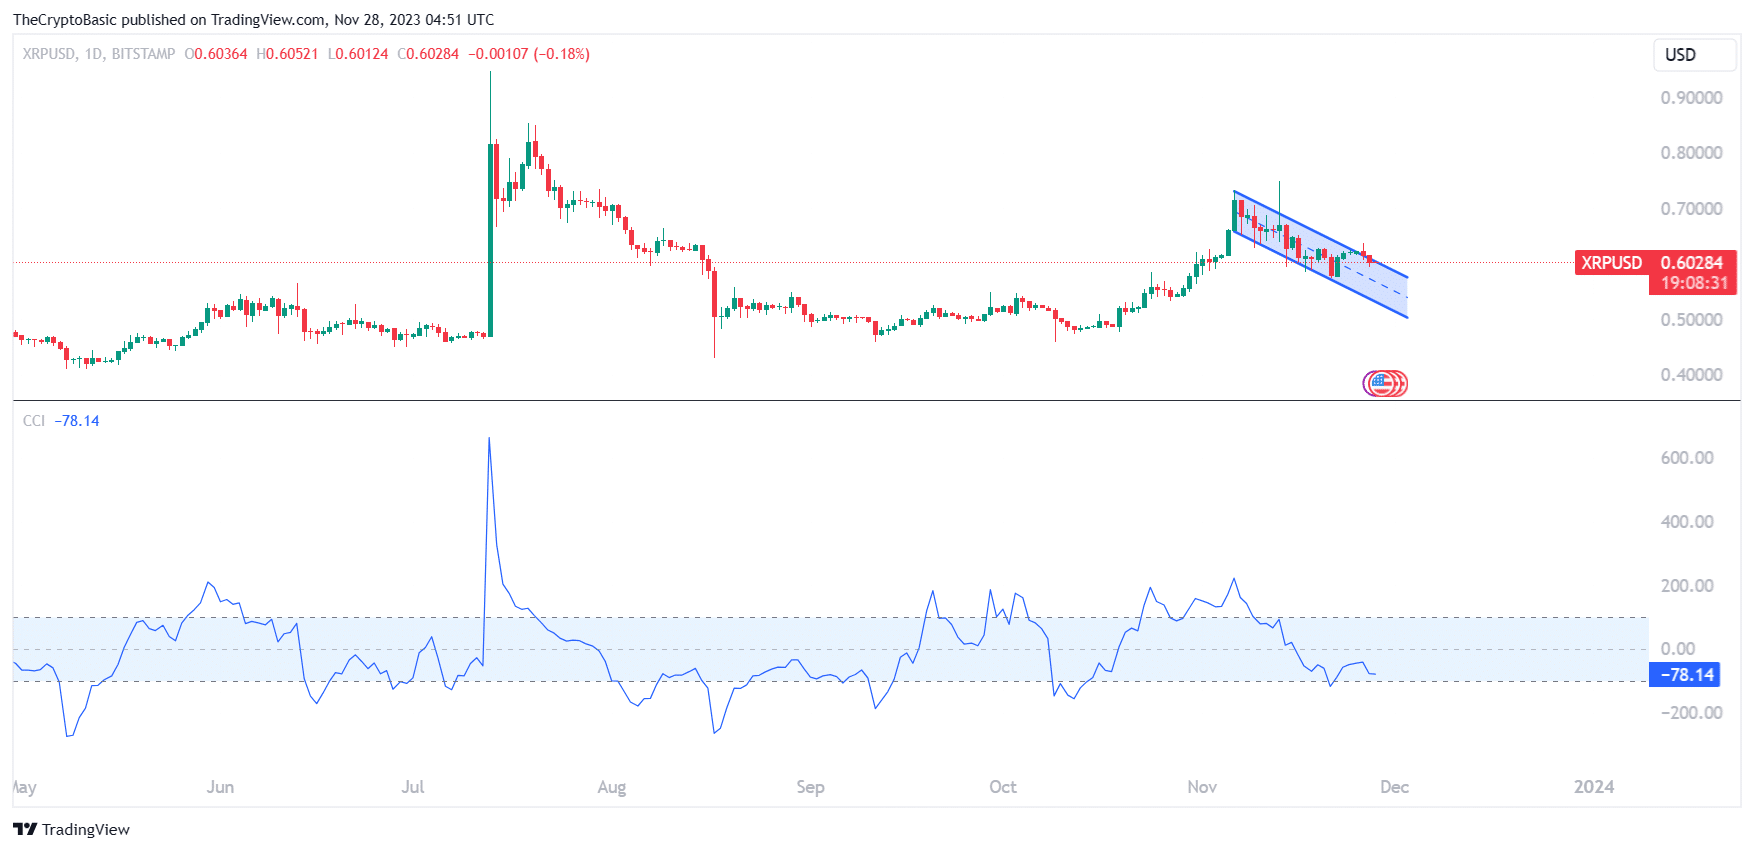
In addition, XRP’s Commodity Channel Index (CCI) currently flashes a -78.14 value. This position indicates that XRP may be slightly oversold at its current level, signaling a looming trend reversal. XRP has also recorded sustained whale accumulation, as reported by The Crypto Basic yesterday.
Amid these bullish indications, market analyst EGRAG recently updated one of his XRP charts to reiterate a $27 ultimate price target. He highlighted $3 and $5.8 as important initial targets for the asset to claim on its journey. However, the analyst confirmed that XRP might face trouble capturing the $6 to $7 zone.


Nonetheless, taking a page from the 2017 upsurge, EGRAG reiterated that the $27 price is a target XRP can achieve. XRP is trading for $0.6028, down 1.31% over the last 24 hours. EGRAG projects a drop to $0.55 in the short term before a rally to $0.75 and $1.3.
Follow Us on Twitter and Facebook.
Disclaimer: This content is informational and should not be considered financial advice. The views expressed in this article may include the author’s personal opinions and do not reflect The Crypto Basic’s opinion. Readers are encouraged to do thorough research before making any investment decisions. The Crypto Basic is not responsible for any financial losses.
-Advertisement-
Source: https://thecryptobasic.com/2023/11/29/xrp-forms-bullish-flag-on-1d-chart-analyst-sets-two-figure-target-on-bullish-momentum/?utm_source=rss&utm_medium=rss&utm_campaign=xrp-forms-bullish-flag-on-1d-chart-analyst-sets-two-figure-target-on-bullish-momentum