Disclaimer: The findings of the following analysis are the sole opinions of the writer and should not be considered investment advice
- Litecoin traded within a range since May
- A move back toward the lows could be on the cards
In early November, Litecoin attempted to break out past the $63 resistance level with a strong show of force. For a few days, the bullish mission was successful. Even though the $72-$80 region would pose stiff resistance, it appeared that Litecoin could make that push higher. Bitcoin, too, had a bullish aura when the price reached the $21.5k mark.
Read Litecoin’s [LTC] Price Prediction 2023-24
Michael Saylor’s mention of Litecoin in recent hours saw the coin experience a hike in social dominance, but no strong effect was seen on the price charts. Lower timeframe charts showed LTC to be in a downtrend, and a move below $60 could see LTC drop all the way down to $50. With Bitcoin beneath the $16.2k support, the bulls could soon face a rough time.
Litecoin retests midrange as support but patience could be key
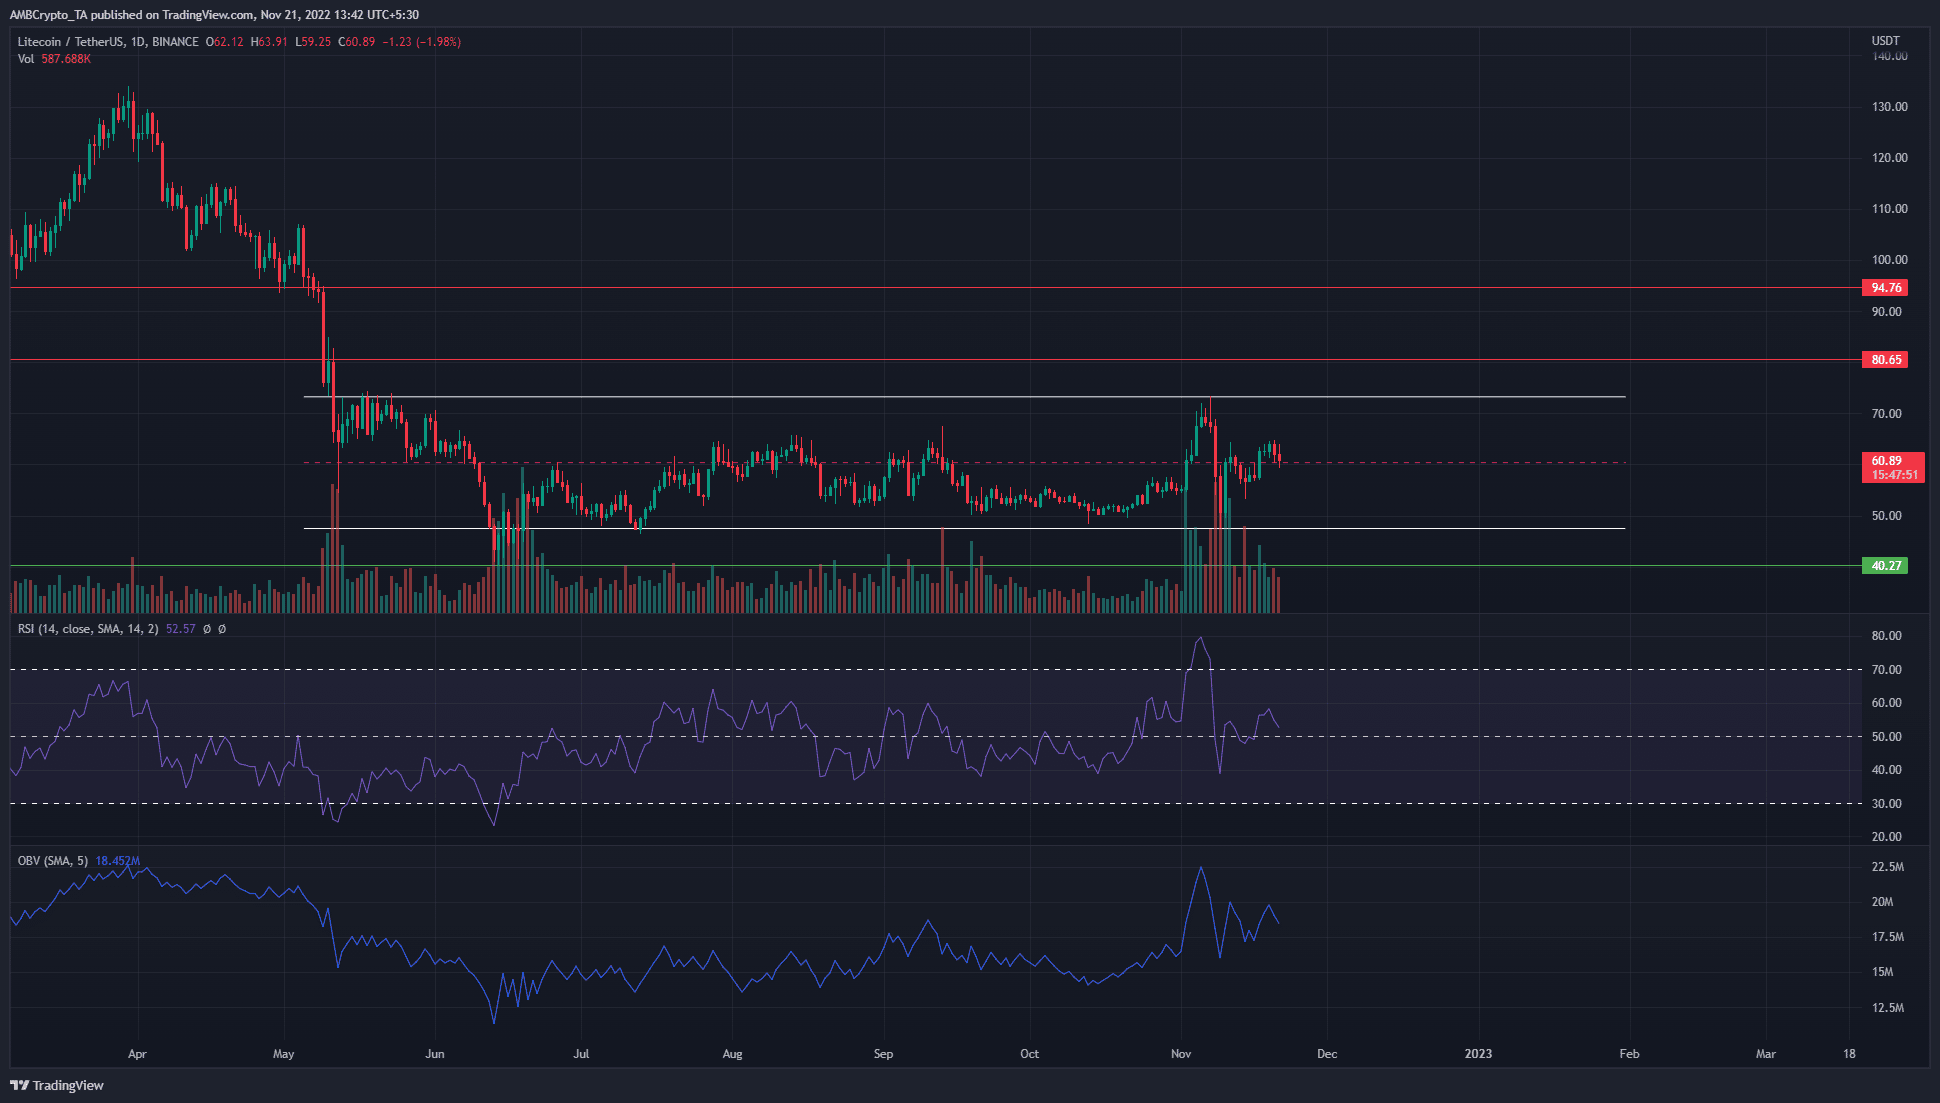
Source: LTC/USDT on TradingView
Litecoin formed a range (white) between $73 to $47.7, with the mid-point of the range (dashed red) at $60.5. LTC has traded within this range since mid-May. In mid-June, the price fell beneath the range lows to test the support at $40.2. Since then the price has bounced back. While the price traded within a range, the On-Balance Volume (OBV) has made higher lows since June.
This indicated heightened buying pressure and could be a sign of accumulation. In early November, Litecoin caught a large bout of volatility. The price pumped to the range highs at $73 but fell to the lows at $47 within a matter of 4 days from 5 November to 9 November.
At the time of writing, the Relative Strength Index (RSI) was just above the neutral 50 line. It hadn’t wandered far from the 40 or 60 values for long periods, which highlighted the fact that LTC did not see a strong trend in recent months.
Neither long nor short positions were a smart choice for higher timeframe traders at press time, as LTC traded near the mid-range mark. A fall beneath the $60 mark can give the lower timeframe bears some impetus.
Mean coin age in decline to show increased coin movement between addresses
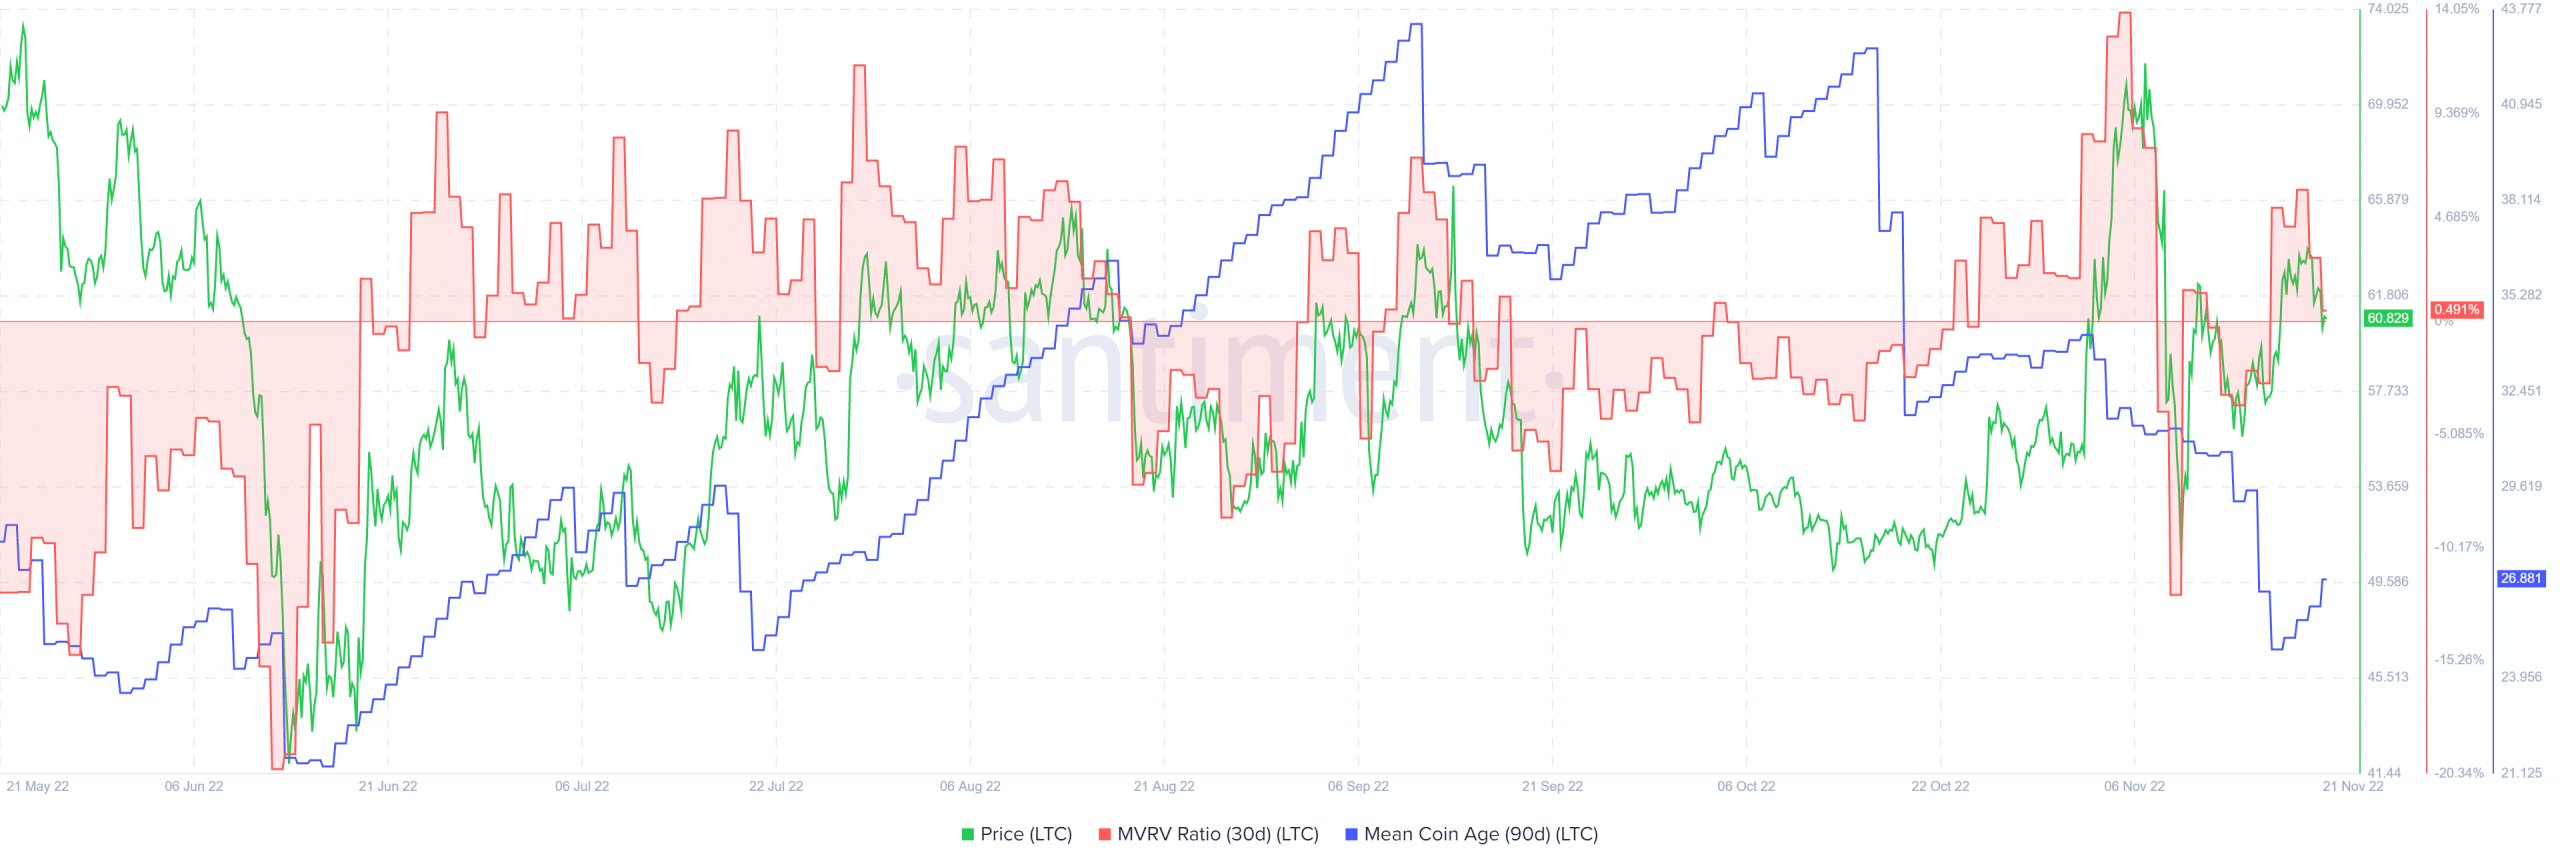
Source: Santiment
The mean coin age (90-day) metric began to slide in October and has been on a descent since. A rise in this metric denoted a network-wide accumulation, while a fall in this figure showed more LTC was being exchanged between addresses. The 30-day Market Value to Realized Value (MVRV) ratio crept into positive territory in the past few days but was back toward the zero mark.
Although relatively low, the peaks on the MVRV have tended to mark local tops in the price. Therefore, there was the possibility that another wave of selling could commence if the MVRV ratio fell beneath 0 to show that, on average, 30-day holders faced losses.
Source: https://ambcrypto.com/why-ltc-may-not-offer-a-buying-opportunity-upon-the-retest-of-60-as-support/