Two prominent analysts have shared similar XRP price charts detailing a possible capitulation event right before an imminent XRP price surge that could replicate the 2017 uptrend.
In a recent report, crypto market watcher JD disclosed that XRP could be on the verge of a meteoric surge. The analyst noted that XRP currently trades within a six-year symmetrical triangle. XRP formed the upper descending trendline of the triangle when it dropped from the $3.3 all-time high.
Historical Context
Data from JD’s chart confirms that XRP traded in a similar symmetrical triangle from late 2013 to early 2017 before its massive rally in 2017. Notably, XRP entered this symmetrical triangle following a collapse from a previous all-time high of $0.0614 in December 2013.
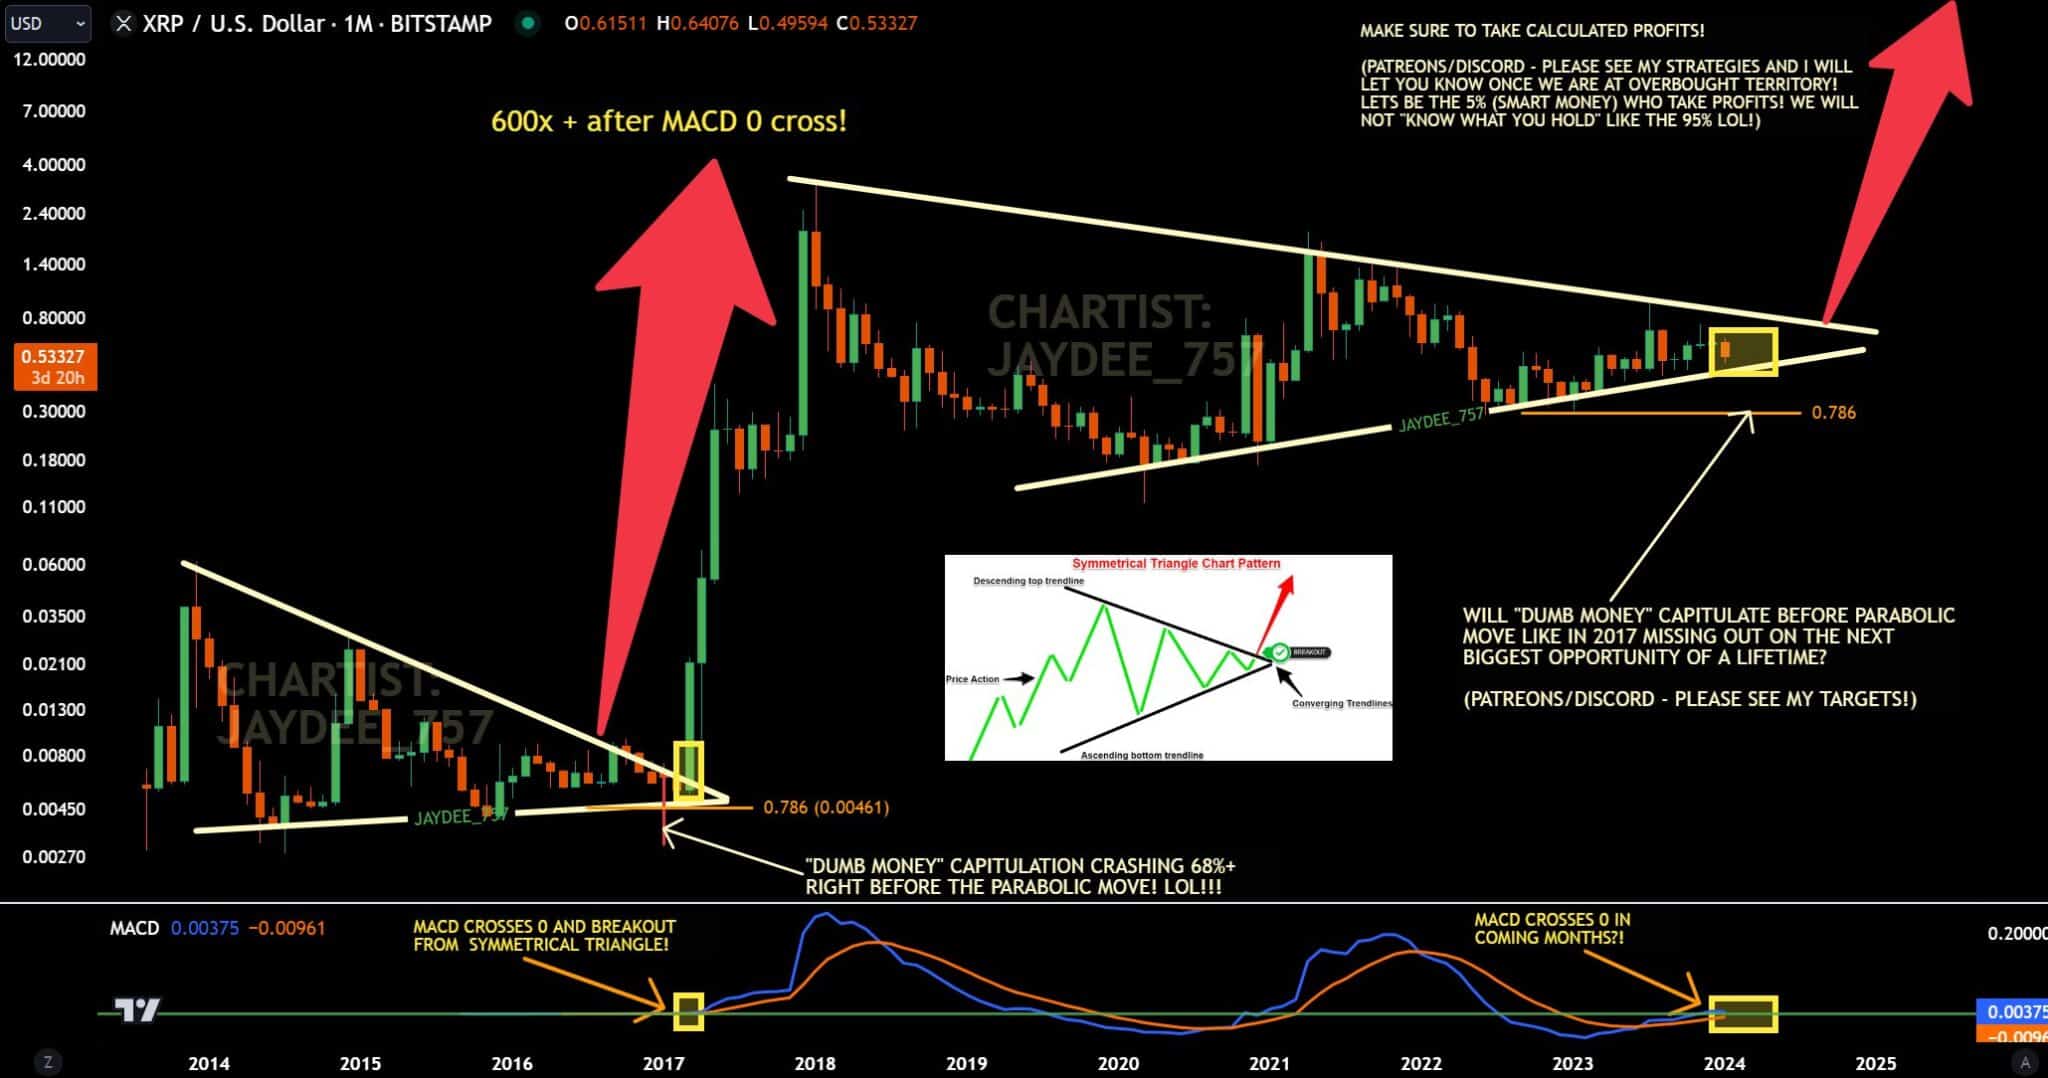
The token continued to record lower highs from December 2013 to early 2017 due to the resistance mounted by the symmetrical triangle’s upper descending trendline. XRP recorded its breakout from the triangle in March 2017.
However, the XRP chart shows a massive wick down in January 2017. According to JD, this wick was due to some XRP investors selling off their holdings amid XRP’s underperformance at the time. Recall that XRP initially lagged Bitcoin (BTC) and the broader crypto market in the 2017 bull run.
Nonetheless, the token eventually recorded a massive surge shortly after this capitulation event. The surge came on the back of the breakout from the previous symmetrical triangle, with XRP soaring 66,100% from a low of $0.005 in February 2017 to $3.31 in January 2018.
XRP Looks to Repeat 2017 Upsurge
JD believes this pattern is about to repeat in the current cycle. Notably, XRP looks poised to break above the latest symmetrical triangle. However, JD says there is the possibility of another massive wick down similar to the one in January 2017.
– Advertisement –
According to the analyst, this would result in a similar capitulation event, as several investors have continued to lament XRP’s underperformance in the current pre-bull run phase. Interestingly, BTC is 62% up since September 2023, while XRP is only 2.6% up within the same timeframe. This reality has triggered investor angst.
The MACD indicator compounds JD’s confidence in another meteoric rise for XRP. In 2017, the breakout from the symmetrical triangle occurred alongside a cross above 0 for the monthly MACD. He expects this MACD cross to fuel the uptrend further.
In an exciting turn of events, The Crypto Sniper, another prominent analyst, claimed JD copied this exact analysis from him. The Crypto Sniper shared a chart he made on this commentary.
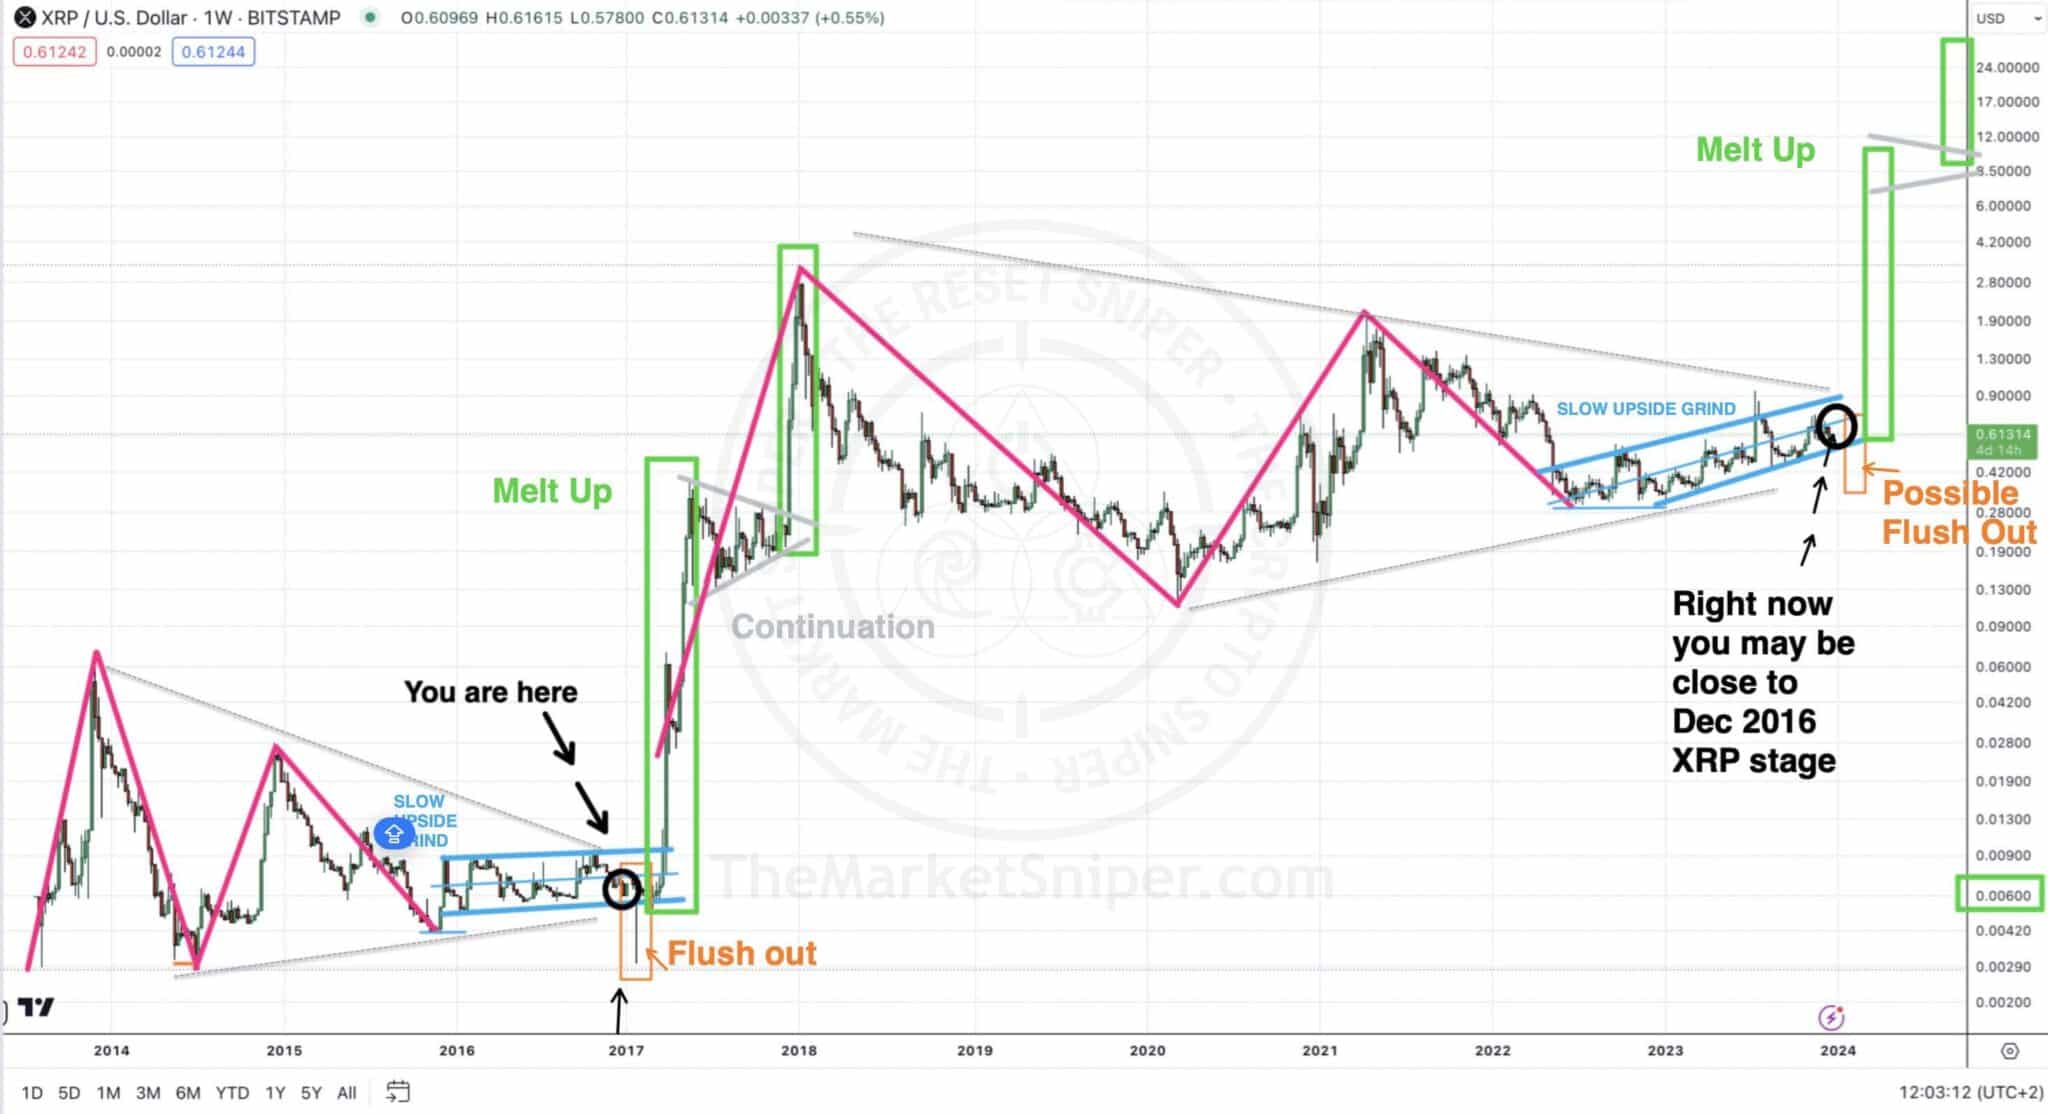
However, The Crypto Sniper asserted that using MACD was inaccurate. While it is uncertain, who copied who, the fact that both analysts have the same setup further solidifies the narrative that XRP could be on the verge of an explosive rally.
Meanwhile, XRP currently changes hands at $0.5247, down 1.28% over the last 24 hours. The crypto asset has collapsed 15% this year amid the market downturn, while BTC is only down by a meager 0.68% within the same timeframe.
Follow Us on Twitter and Facebook.
Disclaimer: This content is informational and should not be considered financial advice. The views expressed in this article may include the author’s personal opinions and do not reflect The Crypto Basic’s opinion. Readers are encouraged to do thorough research before making any investment decisions. The Crypto Basic is not responsible for any financial losses.
-Advertisement-
Source: https://thecryptobasic.com/2024/01/30/upcoming-mega-xrp-surge-analysts-reveal-how-most-investors-would-miss-out/?utm_source=rss&utm_medium=rss&utm_campaign=upcoming-mega-xrp-surge-analysts-reveal-how-most-investors-would-miss-out