The recent market rally has spurred Uniswap (UNI) to attempt a break above the upper line of its horizontal channel.
However, as bearish forces dominate the market, the price of the L2 token might head back toward support.
Uniswap Witnesses Low Market Activity
The general market consolidation has caused the token’s price to trend within a narrow range in the past few weeks, creating a horizontal channel.
A horizontal channel is formed when an asset’s price trades within a defined price range for a sustained period. UNI formed this channel on April 13, and its price has since bounced between resistance at $8.35 and support at $6.73.
At press time, UNI trades at $7.48, rallying toward the upper line of this channel, which forms resistance. However, bearish activity abounds, possibly forcing a price reversal toward support.
UNI’s daily whale transactions have declined in the last month. For daily transactions worth above $100,000, the count has declined by 44%. For bigger transactions worth more than $1 million, the number completed daily has also dropped by over 50% in the past 30 days.
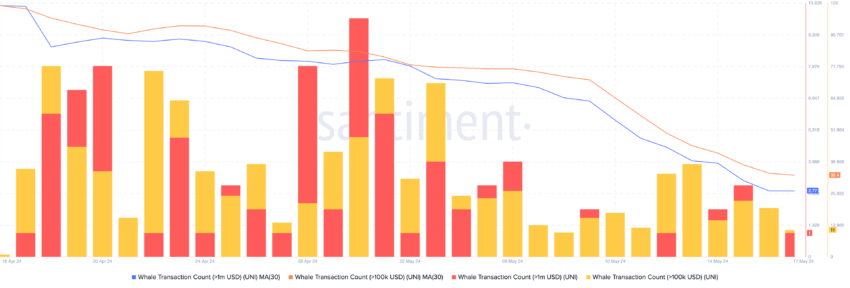
When an asset witnesses a decline in whale activity, it may experience a drop in trading volume, making its market less liquid. This has played out in the UNI market over the last month, with its daily trading volume dropping by 48% during that period.
In addition to reduced whale activity, UNI’s futures open interest has been downtrend in the last week. At $76 million at press time, it has fallen by 5% in the last seven days.
Read More: How To Buy Uniswap (UNI) and Everything You Need To Know
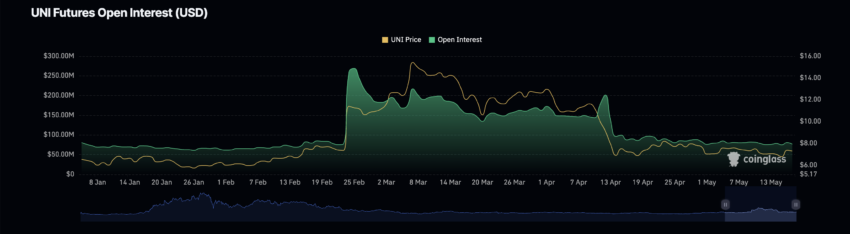
UNI’s futures open interest tracks the total number of outstanding futures contracts or positions that have not been closed or settled. When it declines, it suggests that traders are exiting their positions without opening new ones.
UNI Price Prediction: Caught Between the Devil and the Red Sea
Readings from UNI’s Directional Movement Index (DMI) confirmed the bearish trend. At press time, the token’s positive directional index (blue) rested below the negative index (red).
When this indicator is set up this way, selling pressure is significantly above buying momentum.
Further, the altcoin’s Relative Strength Index (RSI) was 46.62, below the 50 neutral line. This also signaled a preference among market participants for UNI distribution.
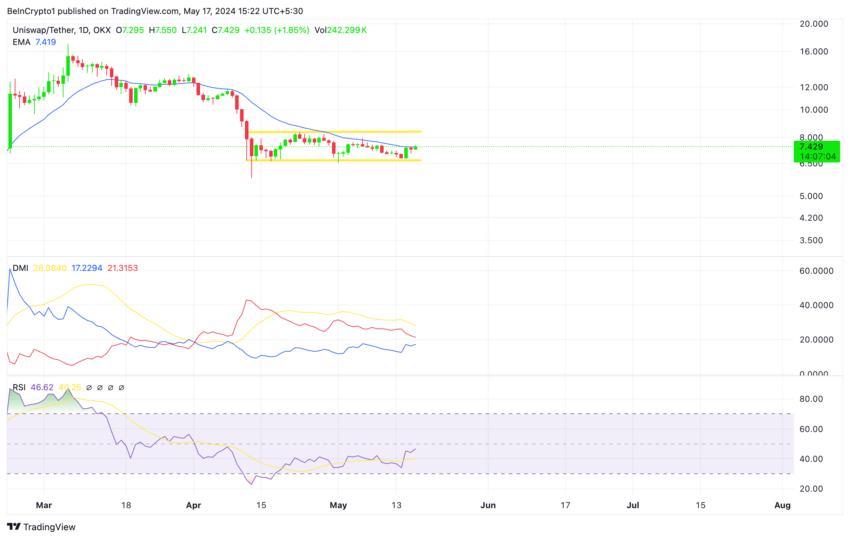
The indicator measures the momentum of an asset’s price change. It ranges from 0 to 100, with values above 70 suggesting overbought conditions and below 30 signaling oversold conditions.
If bearish pressure mounts and UNI reverses its current trend, its price might fall to $7.06 and head toward support at $6.73.
Read More: Uniswap (UNI) Price Prediction 2023/2025/2030
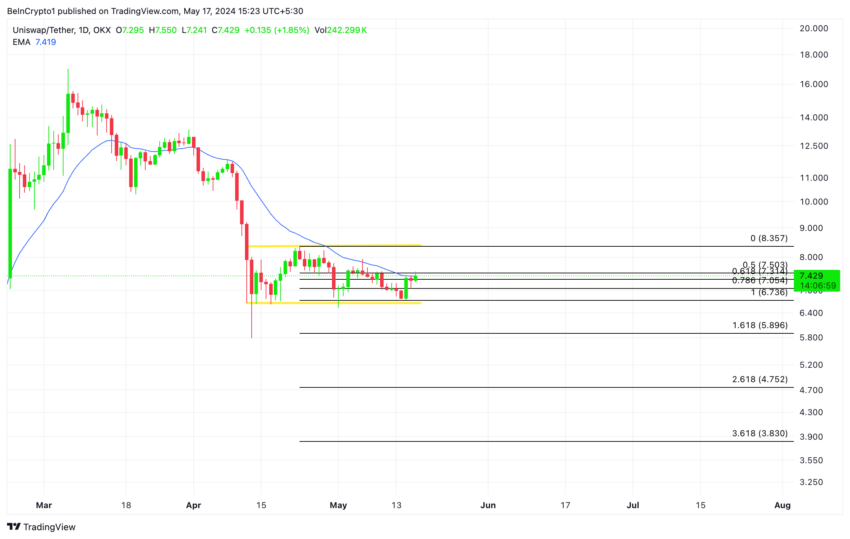
However, if buying momentum intensifies and the token continues its move toward the upper line of the horizontal channel, it may exchange hands at $7.5 before attempting to breach resistance.
Disclaimer
In line with the Trust Project guidelines, this price analysis article is for informational purposes only and should not be considered financial or investment advice. BeInCrypto is committed to accurate, unbiased reporting, but market conditions are subject to change without notice. Always conduct your own research and consult with a professional before making any financial decisions. Please note that our Terms and Conditions, Privacy Policy, and Disclaimers have been updated.
Source: https://beincrypto.com/uniswap-uni-attempts-rally-roadblocks/