

Solana (SOL) surges over 10% and gaining pace above $105. SOL price seems to be setting up for an upside break above the key resistance levels.
SOL price started a fresh rally above the $100 resistance against the US Dollar. The price is now trading above $114.7 and the 100 simple moving average (4 hours).
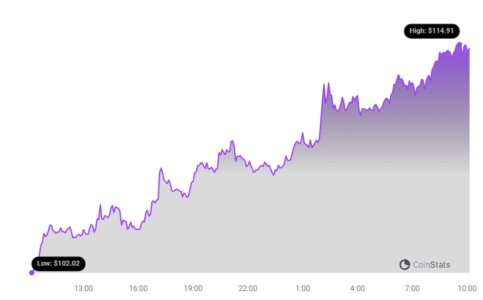
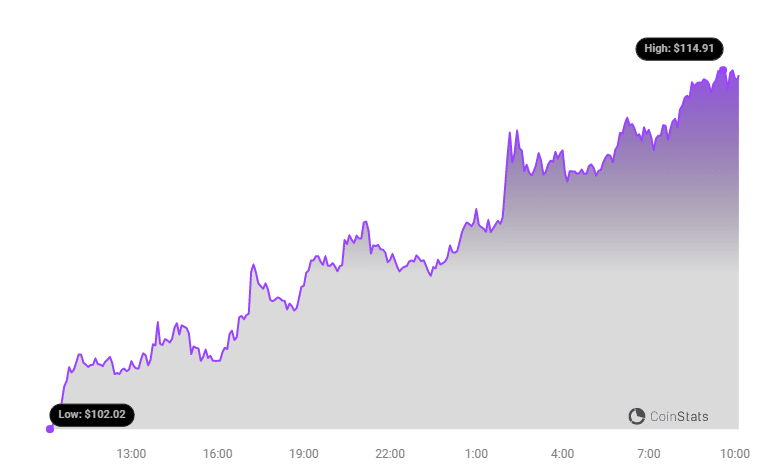
There was a break above a key contracting triangle with resistance near $104 on the 4-hour chart of the SOL/USD pair (data source from Kraken).
The pair could continue to rally if there is a clear move above the $118 resistance.
Solana Price Starts Fresh Rally
After a downside correction, Solana found support near the $93.50 level. SOL formed a base and recently started a fresh increase above the $100 resistance.
It is up over 10% today, outperforming Bitcoin and Ethereum. There was a move above the 50% Fib retracement level of the downward move from the $126.13 swing high to the $93.50 low.
Besides, there was a break above a key contracting triangle with resistance near $104 on the 4-hour chart of the SOL/USD pair.
SOL is now trading above $105 and the 100 simple moving average (4 hours). On the upside, immediate resistance is near the $114 level.
The first major resistance is near the $118 level or the 76.4% Fib retracement level of the downward move from the $126.13 swing high to the $93.50 low.
See Also: Top 3 Altcoins To Boost Your Cryptocurrency Portfolio In 2024
The main resistance is now near $125. A successful close above the $125 resistance could set the pace for another major rally.
The next key resistance is near $138. Any more gains might send the price toward the $145 level.
Possibility Of Another Drop In SOL?
As with any volatile asset, there is the possibility of a downside correction. If SOL fails to rally above the $118 resistance, it could start a downside correction. Initial support on the downside is near the $108 level.
The first major support is near the $100 level or the 100 simple moving average (4 hours), below which the price could test $94.
If there is a close below the $94 support, the price could decline toward the $80 support in the near term.
Technical Indicators
- 4-Hours MACD – The MACD for SOL/USD is gaining pace in the bullish zone.
- 4-Hours RSI (Relative Strength Index) – The RSI for SOL/USD is above the 50 level.
- Major Support Levels – $108, and $100.
- Major Resistance Levels – $118, $125, and $138.
Disclaimer: The information provided is not trading advice. Bitcoinworld.co.in holds no liability for any investments made based on the information provided on this page. We strongly recommend independent research and/or consultation with a qualified professional before making any investment decisions.
Source: https://bitcoinworld.co.in/sol-surges-over-10-as-solana-breaks-key-resistance-levels-aiming-new-high/