Disclaimer: The information presented does not constitute financial, investment, trading, or other types of advice and is solely the writer’s opinion
- Uncertainty and fear across the market meant conditions are ripe for another drop in prices.
- This could arrive alongside large volatility so risk management remains crucial.
Shiba Inu noted losses of close to 20% within ten days of dropping beneath the level of support at $0.000012. Recently, the strong selling pressure forced SHIB to leave an imbalance on the charts, which was retested before prices continued to plunge.
Read Shiba Inu’s [SHIB] Price Prediction 2023-24
Now, another such imbalance was seen. However, the reaction from this zone has not been as clean as before. Was this a sign that a reversal was about to arrive, or will the bears continue to book profits on the meme coin?
History doesn’t repeat itself but it often rhymes
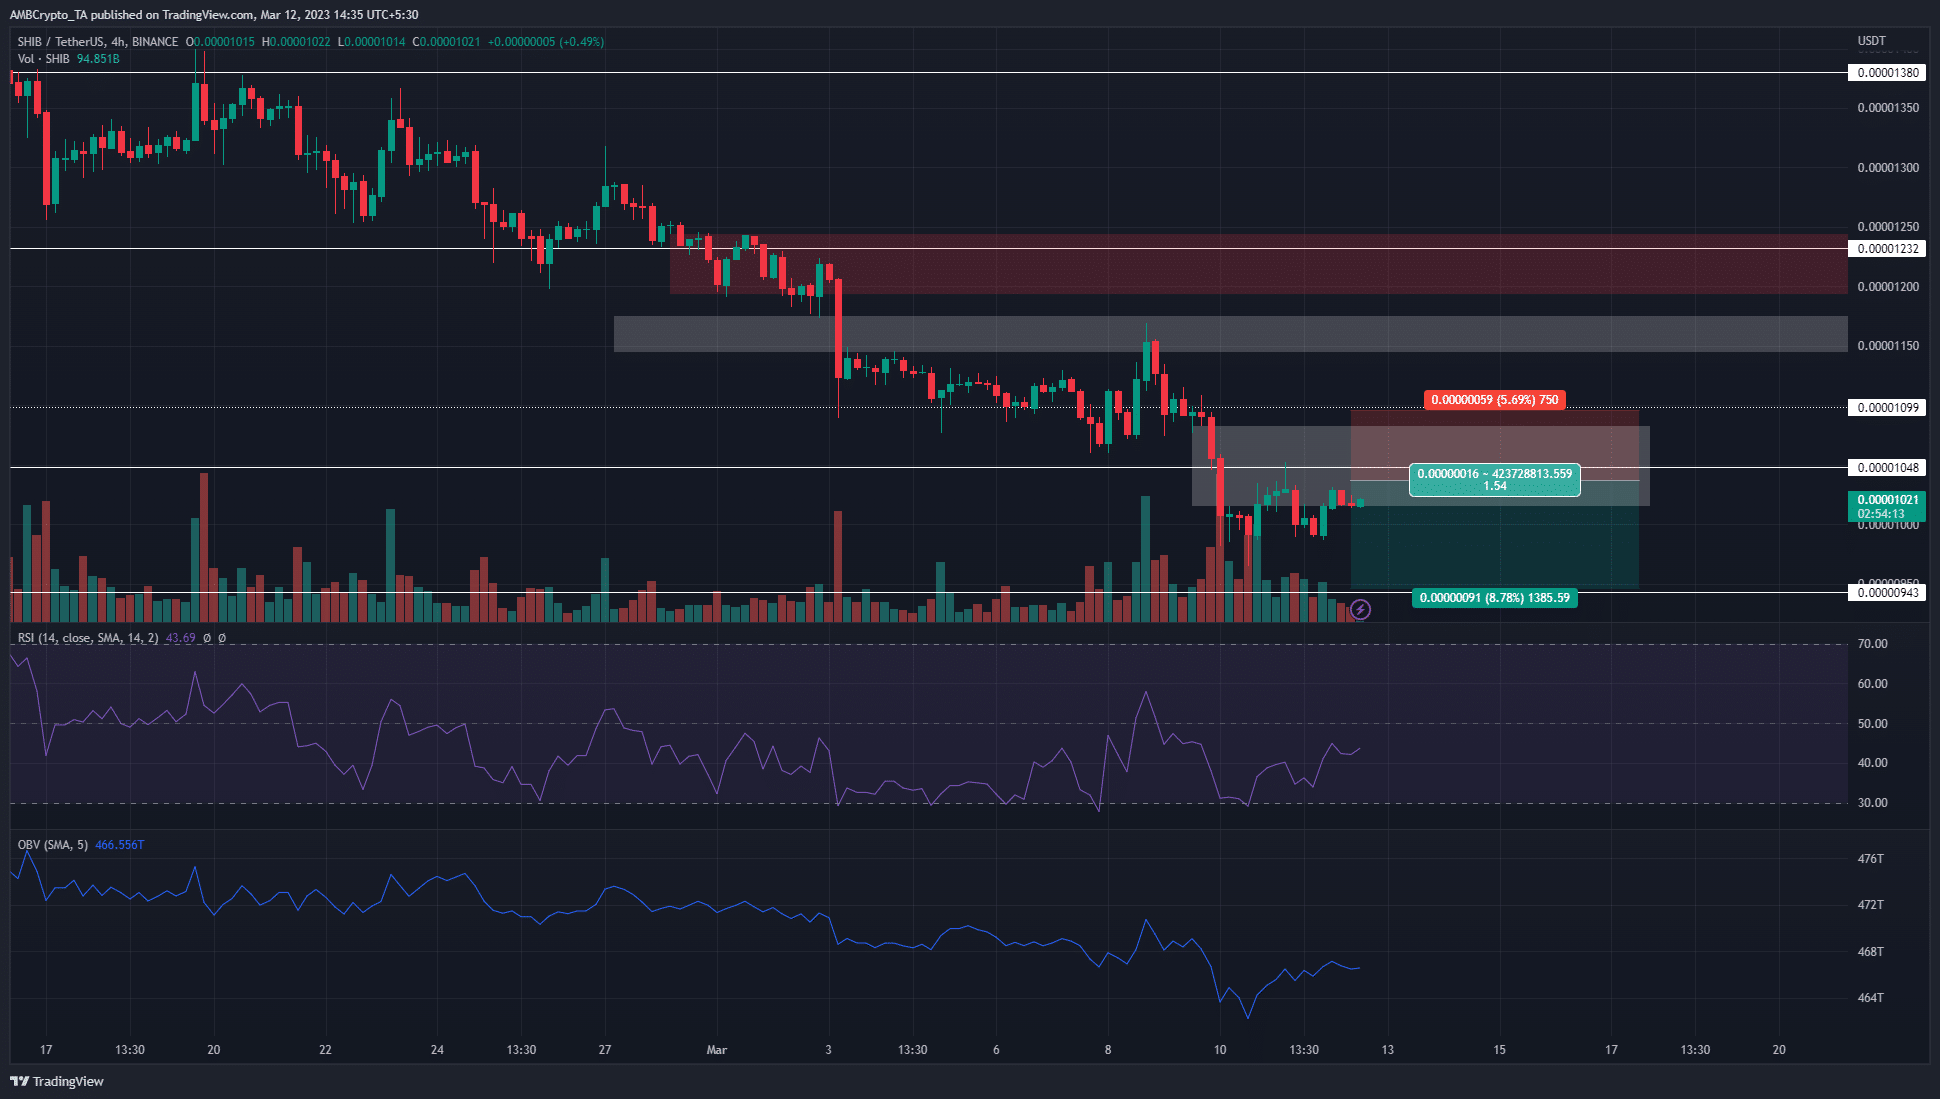
Source: SHIB/USDT on TradingView
In white, two fair value gaps on the 4-hour chart are marked. The RSI was below neutral 50 over the past two weeks to indicate strong bearish momentum and a downtrend. The market structure was also bearish on the H4 and D1 timeframes. Therefore the bias of Shiba Inu was bearish.
The OBV has also been in decline, in agreement with the trend, and highlighted steady selling pressure. To the south, the $0.00000943 and $0.0000088 levels were worth watching out for, as they were two levels that the price respected since November, especially $0.00000943.
Unlike the previous surge into the FVG and rejection, the move into the imbalance in the past couple of days did not meet a quick rejection. This indicated the possibility that buyers had found their footing in the market.
Bitcoin faced heavy resistance from $20.6k to $21.2k, and Monday could lend some clarity to the price action. There was a chance that BTC, and many altcoins, will experience a minor surge to grab liquidity above the local highs made this weekend. For Shiba Inu, such a move would take it toward the $0.0000105 area.
Is your portfolio green? Check the Shiba Inu Profit Calculator
After this fake rally, the price can continue to descend on its prior downtrend. SHIB would need to close a session above $0.0000105 to give the suggestion of a bullish structure.
Even then, there would likely be resistance from the bearish breaker at $0.0000109. Hence, more cautious traders can choose to wait for more clarity instead of attempting to short the asset.
The funding rate was positive but the sentiment was not
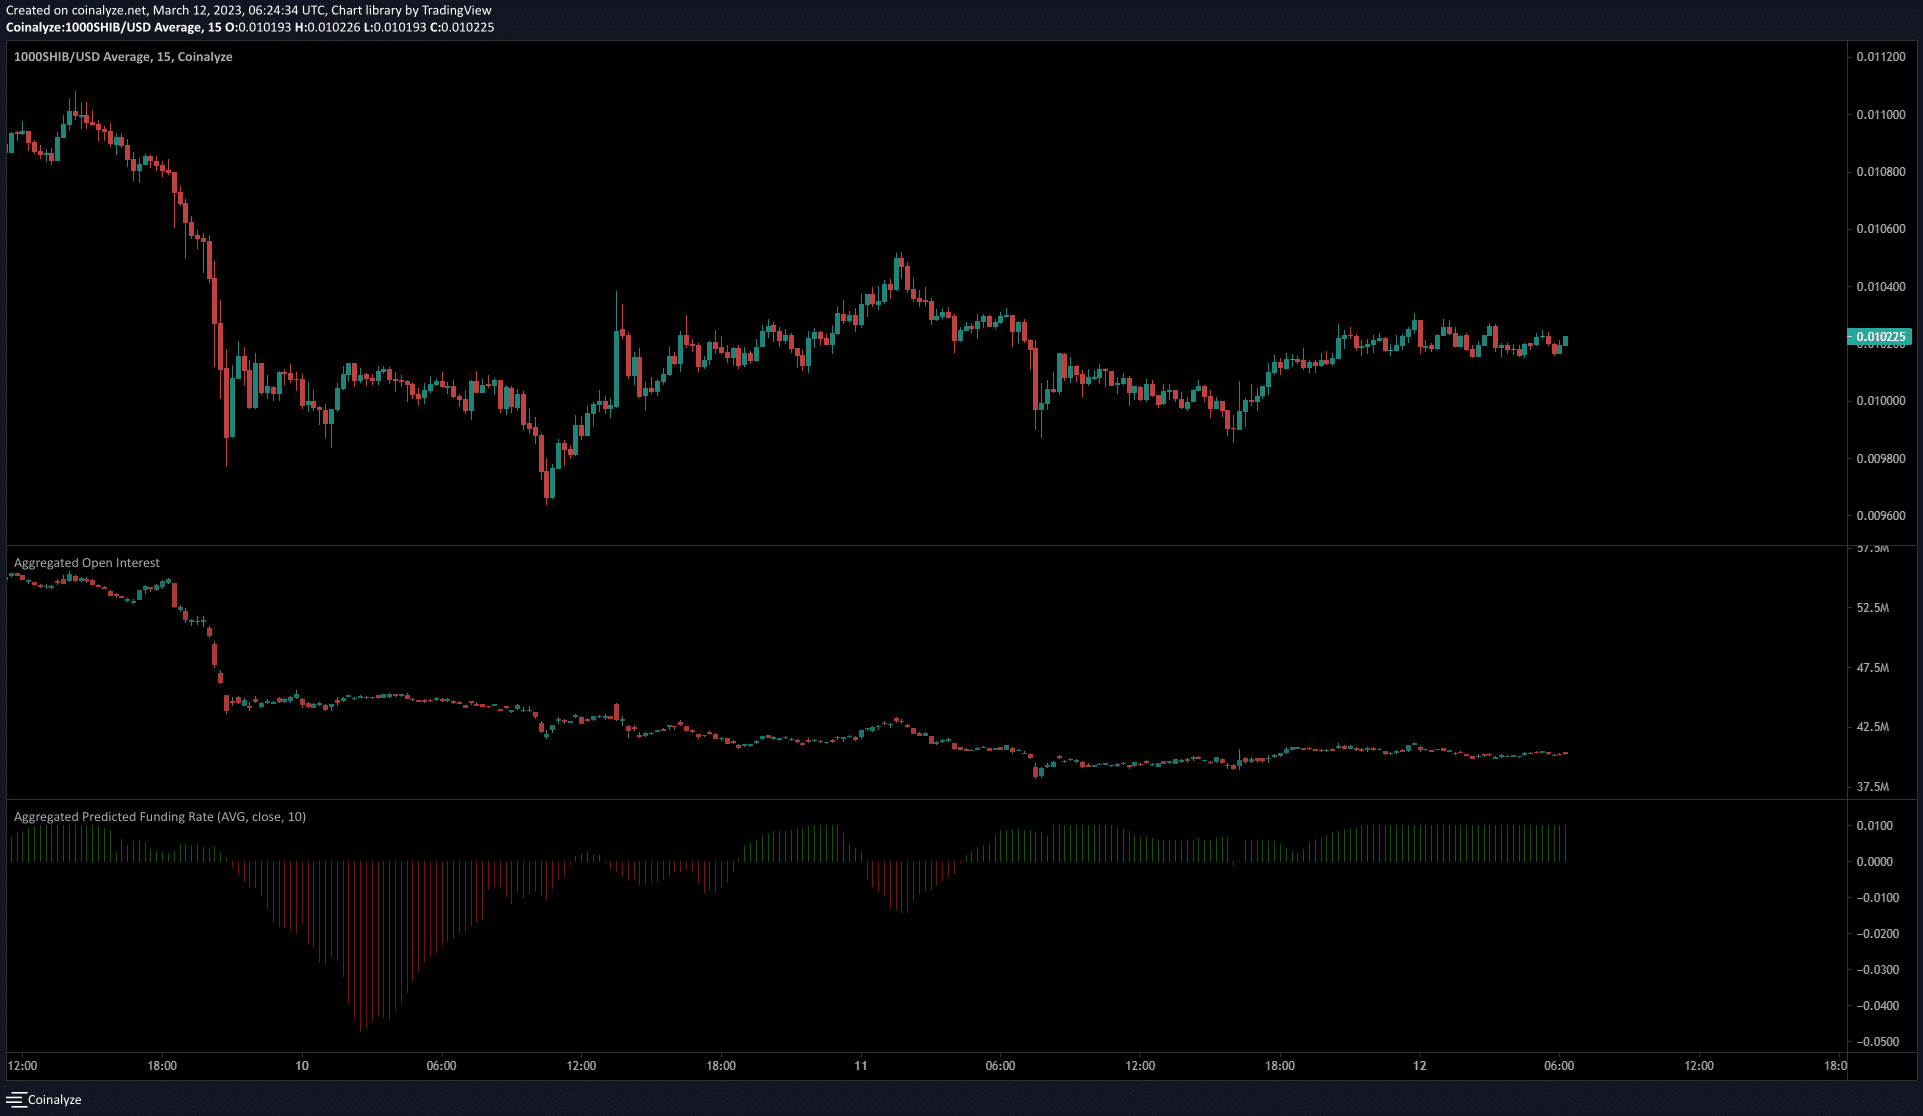
Source: Coinalyze
The funding rate was positive over the weekend and showed that sentiment could begin to shift in favor of the buyers. But the Open Interest showed no significant spike even though the prices saw a small bounce of 3.5% in the past 24 hours.
This highlighted long positions to be discouraged and implied bearish sentiment was strong. Yet, the conditions were risky across the market for both buyers and sellers, and risk management as always would be a top priority.
The evidence at hand showed a continuation of the downtrend was a highly probable outcome for Shiba Inu over the next week.
Source: https://ambcrypto.com/shiba-inu-presents-another-imbalance-on-the-charts-should-you-short-it/