- Polkadot recorded immense growth in new and active accounts over the past two weeks
- The sharded protocol’s development activity surged amid a recent DOT hike but the crypto is less likely to improve the performance
Polkadot [DOT], in its latest round-up of the past week activities, announced that new accounts on its chain multiplied ten times from the status of the previous two weeks. Confirming the initial report by dotinsights, active accounts also grew about 400% within the same period.
2/ The number of daily new accounts on Polkadot has SURGED by nearly 10 times in the past 2 weeks alone, while active accounts have increased 4 times! https://t.co/bbHPRVPGcz
— Polkadot (@Polkadot) November 14, 2022
Read Polakdot’s [DOT] Price Prediction 2023-2024
However, there was more to the developments than just account increases. In other aspects, TRAC, the utility token of the Original Trail parachain launched live on the Polkadot network.
Development hikes and derivatives pull down
Following the update, DOT’s development activity soared. According to Santiment data, the blockchain’s development activity increased from its low point of 61.67 on 7 November. As of this writing, it was a whopping 99.5. At this phase, it implied that Polkadot had prioritized upgrades to its chain, which was evident with the series of collaborations it rolled out recently.
In addition, the DOT price also aligned with the development state. This was due to the data shown on the on-chain analytics platform. As of this writing, DOT was trading at $5.857 — a 3.19% increase in the last 24 hours.
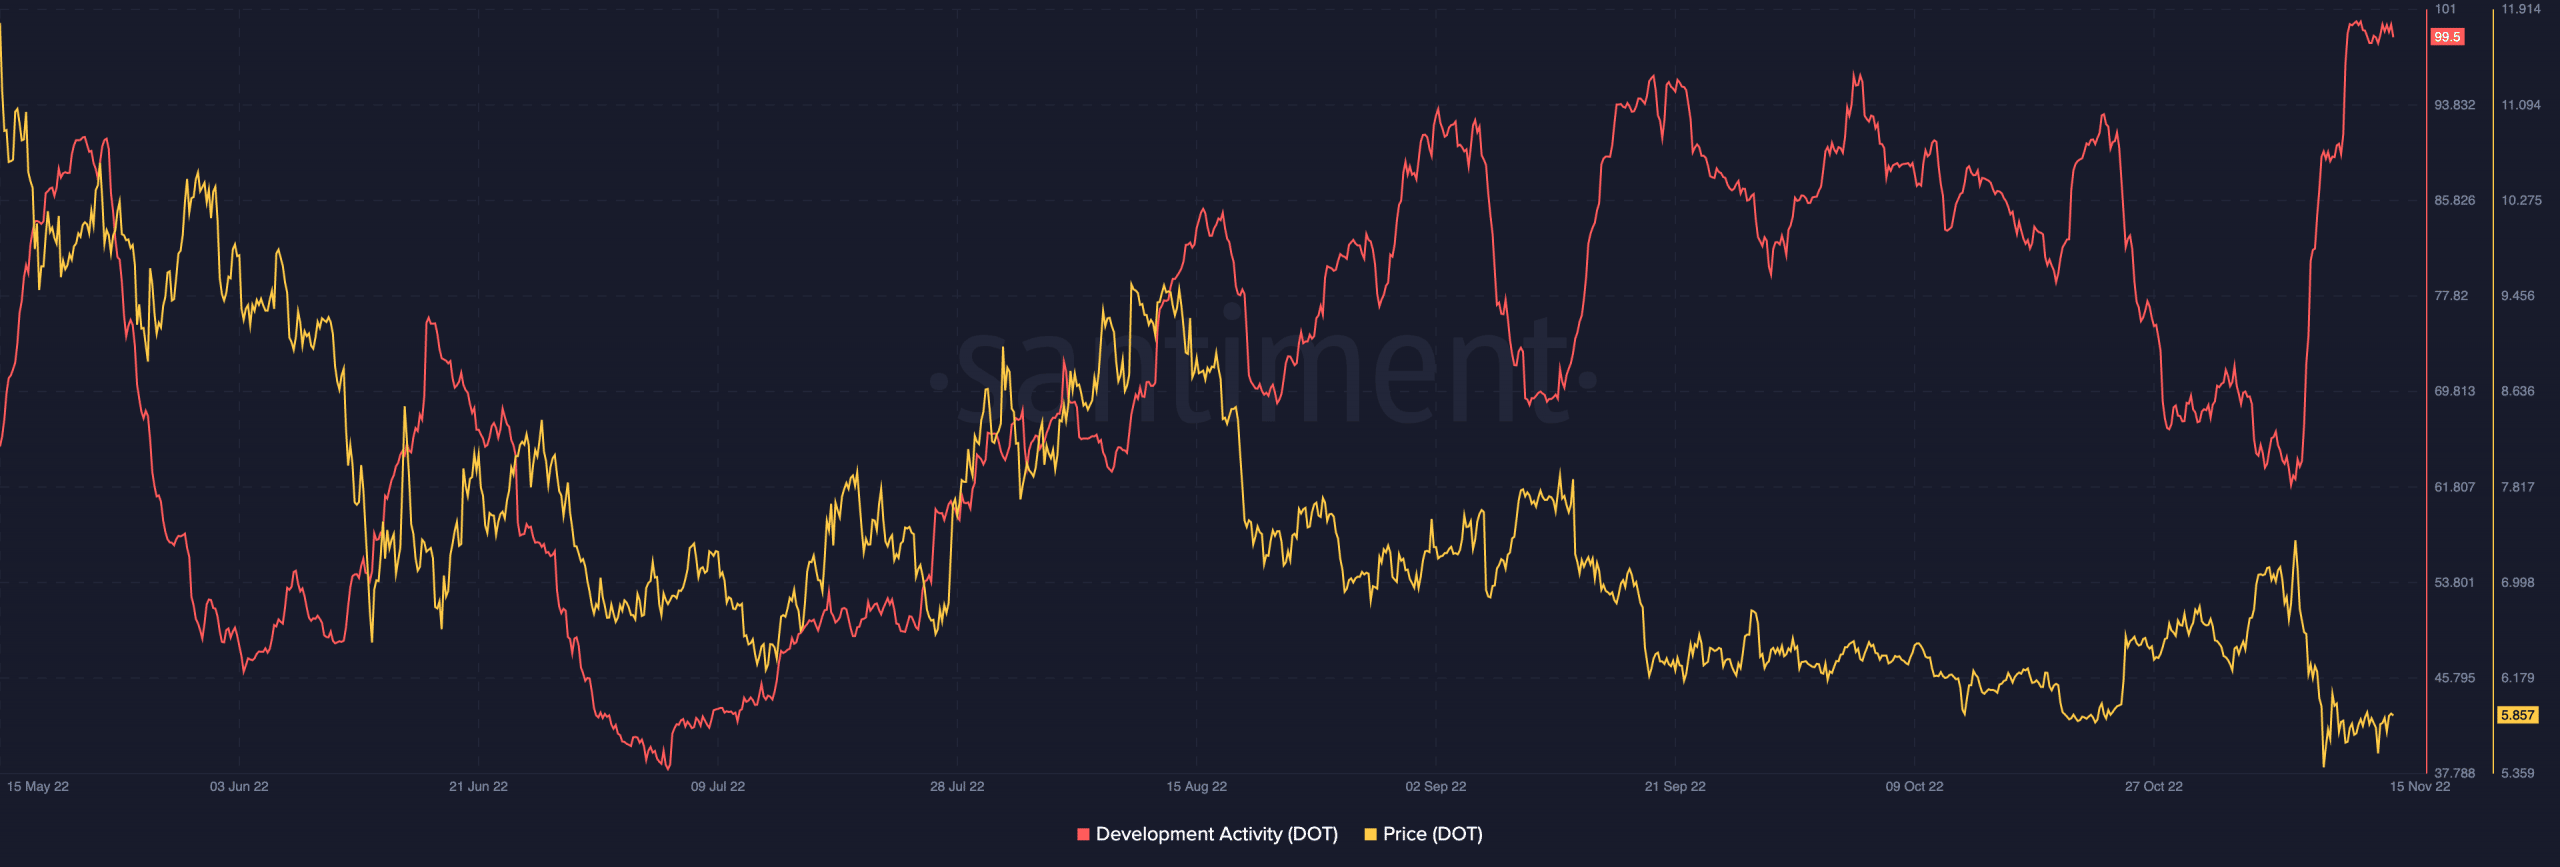
Source: Santiment
However, the increase in active accounts did less to impact traders sentiment. At press time, data from Santiment showed that there had been a decline in the Binance funding rate.
At -0.012%, it implied that derivatives market traders were hardly looking at DOT to potentially make profits. This state also translated to a decrease in options and futures market interest.
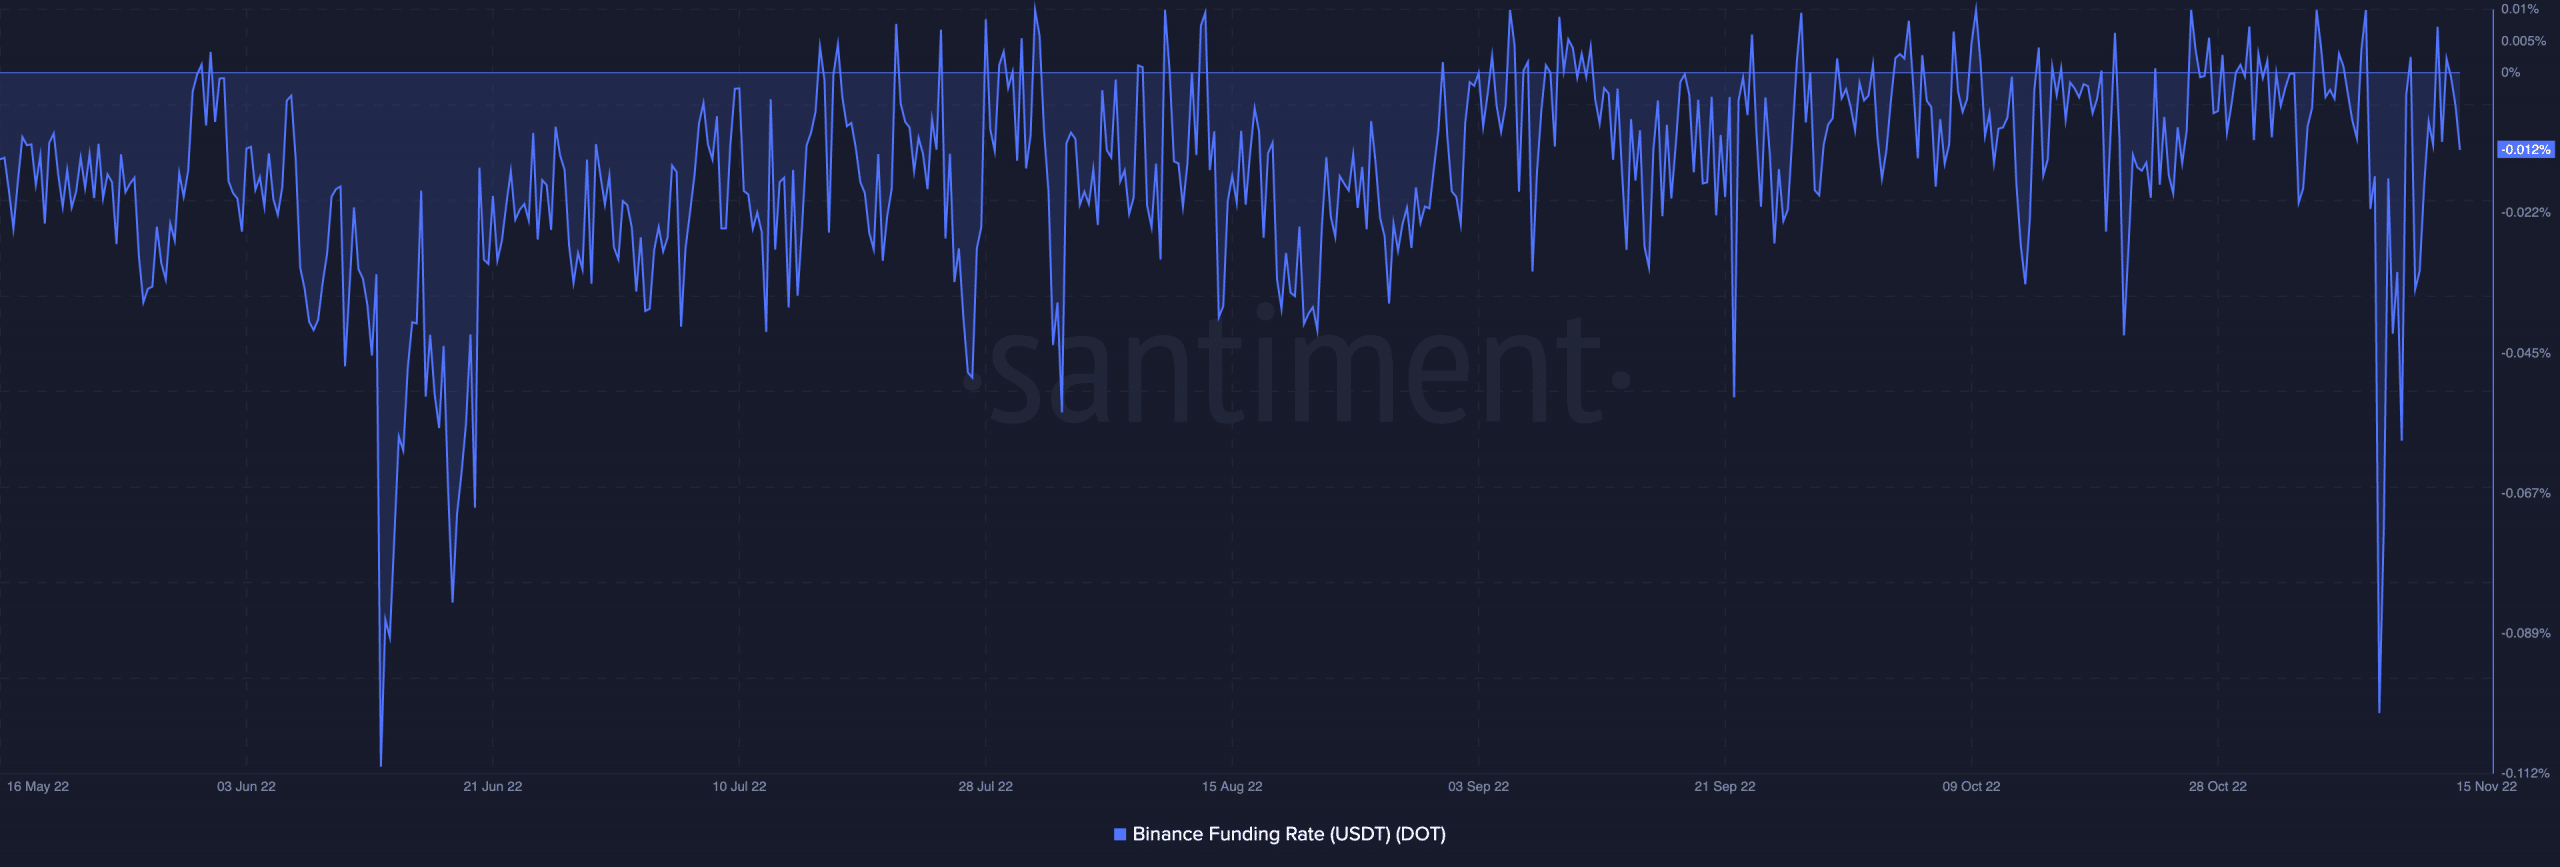
Source: Santiment
Despite the interest subside, active DOT traders felt the wrath of the market still. According to Coinglass, DOT’s liquidations were $419.320 in the last 24 hours. A close look at the liquidation data revealed that long-positioned traders were mostly the victims of the 14 November wipeout.
While shorts were liquidated $251,250 on the said date, longs lost $555,770 to the market. Considering the situation, it meant that the decreases DOT experienced for most of 14 November, impacted the futures and options outcome.
However, data from the derivative tracking platform showed that shorts had mostly been the casualty of 15 November, owing to the uptick DOT registered lately.
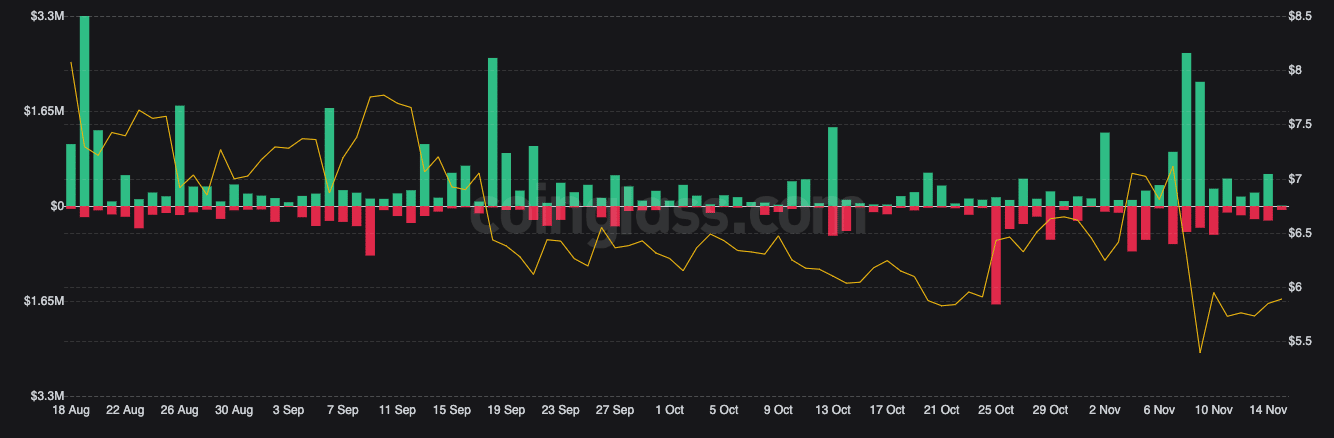
Source: Coinglass
Cut to the chase
Per the four-hour chart, it was likely that DOT lost the greens’ sustenance. This indication was revealed by the Directional Movement Index (DMI). According to the DMI, the seller control (red) was above the buyer strength (green). Despite being at 20.79, the Average Directional Index (ADX) seemed to support its stay over the buyers.
With the Average Directional Index (ADX) at 30.98, DOT’s possible movement indicated support to the bearish side. However, the aforementioned possibility did not mean certainty especially as the Relative Strength Index (RSI) maintained a good buying momentum at 52.47.
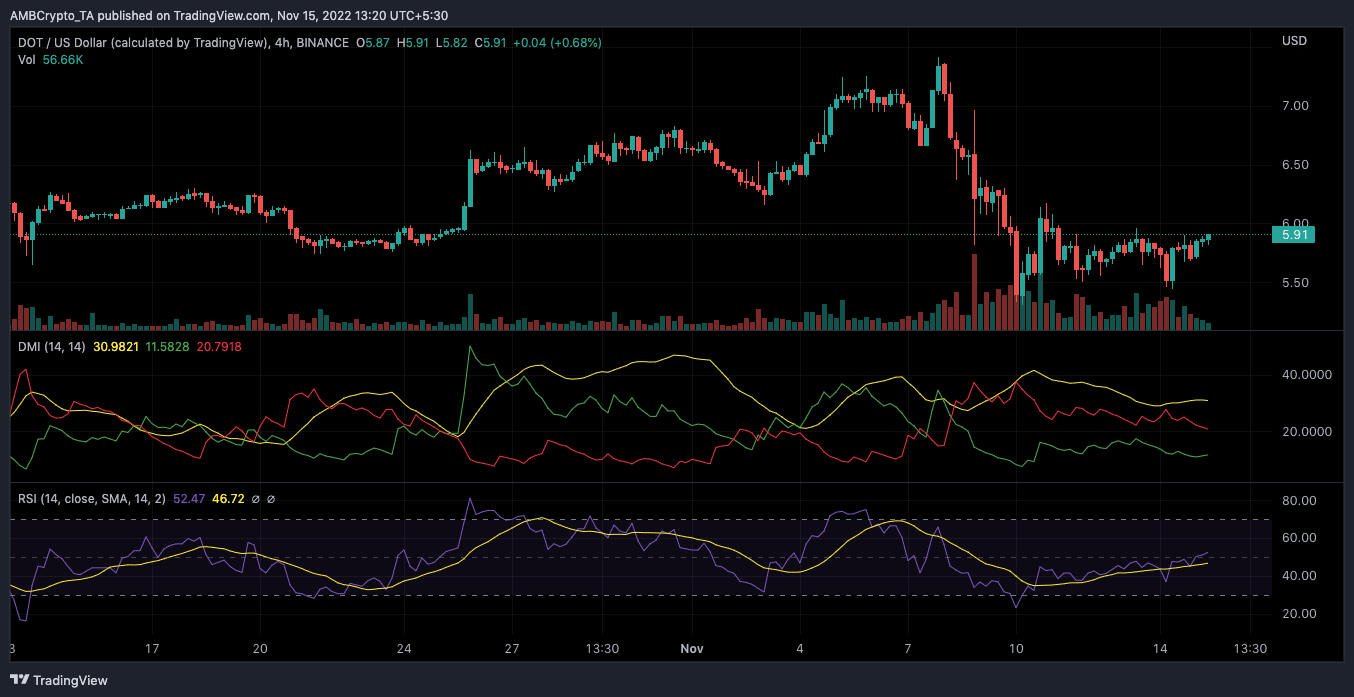
Source: TradingView
Source: https://ambcrypto.com/polkadot-records-surges-but-dot-seems-to-be-caught-in-the-crossfire-between/