Join Our Telegram channel to stay up to date on breaking news coverage
Loopring (LRC) is recovering after turning away from the $0.45 barrier. The Loopring price had escaped from a bullish chart pattern after rising as much as 28% on Friday. This set the token up for a massive move northward. Where is LRC headed next? Let’s find out.
Loopring Price Bulls To Exploit A Bullish Flag As They Eye $0.66
After recording a swing low of $0.18, the Loopring price embarked on a recovery that saw it rally 140% in January to reach $0.446, levels last seen in August 2022. The price then turned down from the said level as sellers sold on the rallies. This correction set a local low at $0.32, before yesterday’s recovery.
This price action has painted a bullish flag as shown on the daily chart below. This is a highly bullish chart formation that projects a massive upward move. It is confirmed once the price produces a daily candlestick close above the flag, confirming a bullish escape.
In Loopring’s case, the price escaped from the governing chart pattern when it rose above the upper boundary of the flag at $0.385. If the recovery is sustained, LRC may climb higher with the first barrier emerging from today’s intraday high at $0.422. Additional roadblocks may be found at the $0.45 psychological level, $0.50 supplier zone, and the $0.55 major resistance level.
Higher than that, the LRC bulls may be bolstered to push the token above $0.60 to tag the $0.66 range high reached on May 22. This would represent a 65% rise from the current levels.
LRC/USD Daily Chart
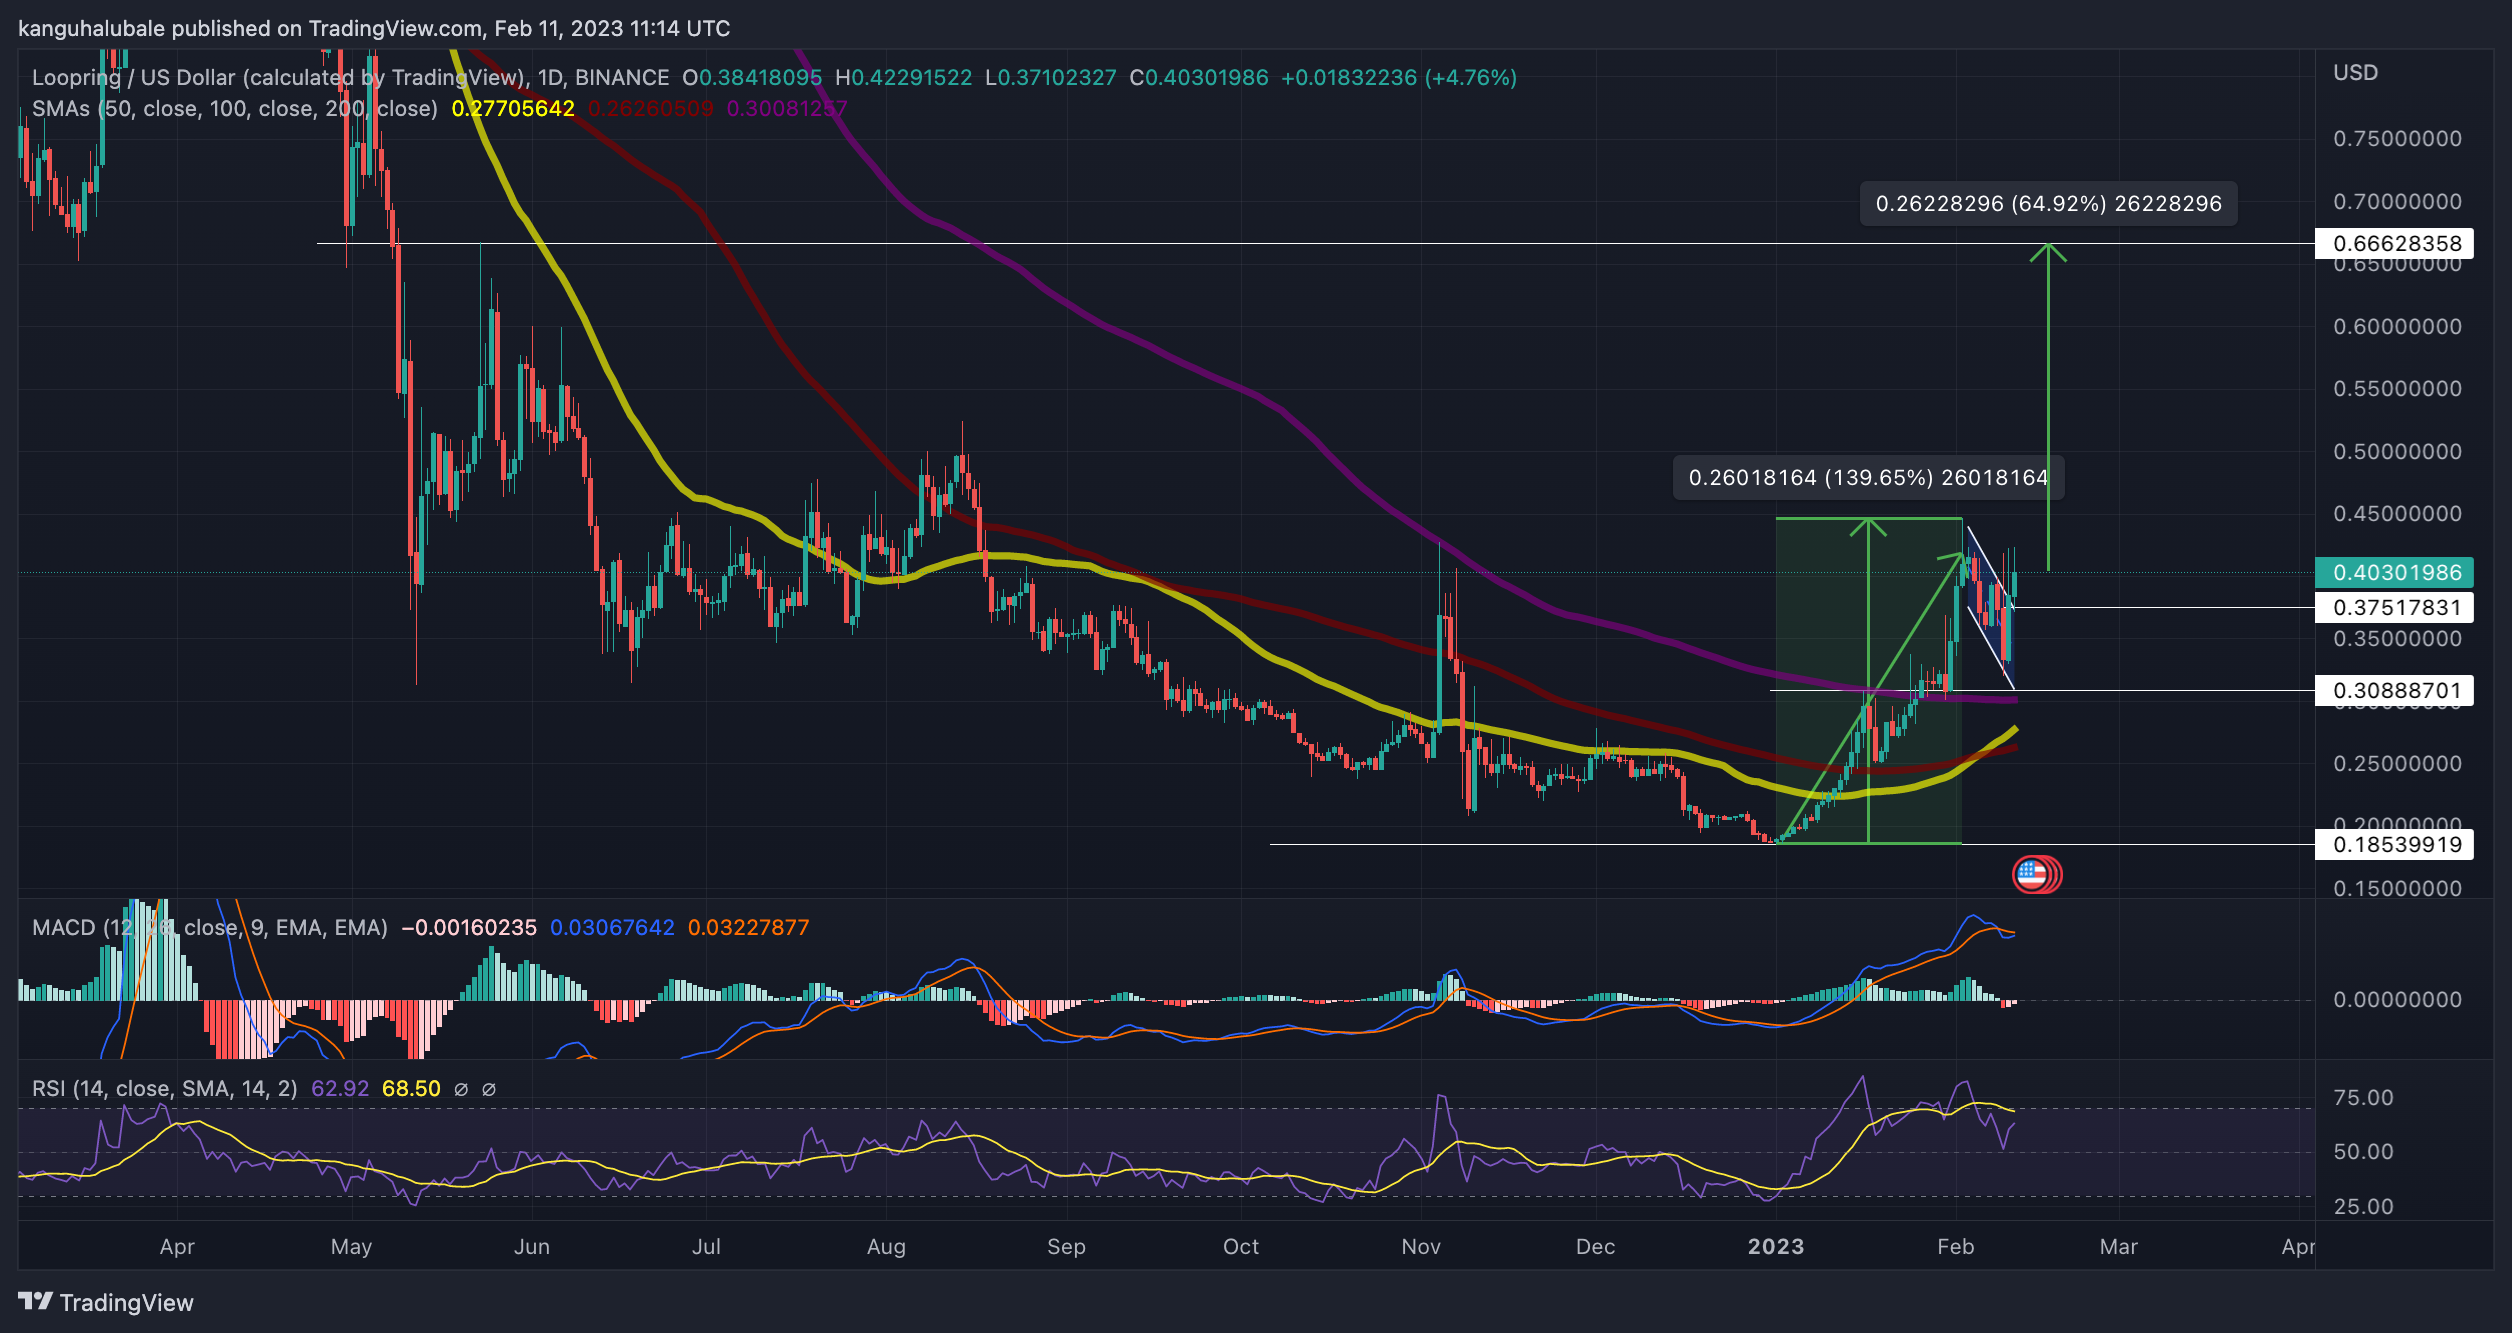
Loopring’s upside was supported by the strong support it enjoyed on the downside. These were areas defined by the upper and lower boundaries of the flag at $0.375 and $0.303 respectively. Other lines of defense were offered by the 200-day, 50-day and 200-day Simple Moving Averages (SMAs) at $0.30, $0.277, and $0.265 respectively.
Also, note that the moving averages have sent a bullish signal on the daily timeframe. This happened on February 7 when the 50-day SMA crossed above the 100-day SMA. Though not a “golden cross”, when the fast-moving MA crosses above a slower-moving one, it usually signals strength amongst buyers.
Moreover, both the Moving Average Convergence Divergence (MACD) indicator and the Relative Strength Index (RSI) were moving upward in the positive region. This suggested that there were more buyers than sellers in the market, adding credence to the bullish thesis. The price strength at 62 showed that the bulls were in control of LRC.
However, things may go awry for the bulls if the Loopring price turns down to produce a daily candlestick close below the flag’s resistance line at $0.375. If this happens, LRC may drop toward the support line at $0.308 or revisit the moving averages below it. Such a move would completely invalidate the bullish narrative for Loopring.
Alternatives To LRC
Besides the Lo0pring, investors may wish to consider investing in new projects currently in presale with a lower risk-reward ratio. Such a project is Meta Masters Guild, whose native token MEMAG is performing well in presale. The team behind MEMAG has already raised more than $4 million, with less than 2 days left in the 6th stage.
💰Stage 6 of the $MEMAG token presale is finishing in 2 days!!!🎮
Tokens are selling fast, make sure you get some for yourself!💰
Become a part of the Meta Masters Guild gaming ecosystem with the power of $MEMAG.🚀
➡️https://t.co/SBqVjX5mWn#Presale #P2E #Play2Earn pic.twitter.com/9uMwYFARrq
— Meta Masters Guild (@MEMAGgames) February 10, 2023
Visit Meta Masters Guild here to find out more about how to participate in the ongoing presale.
More News
Meta Masters Guild – Play and Earn Crypto

- Innovative P2E NFT Games Library Launching in 2023
- Free to Play – No Barrier to Entry
- Putting the Fun Back Into Blockchain Games
- Rewards, Staking, In-Game NFTs
- Real-World Community of Gamers & Traders
- Round One of Token Sale Live Now – memag.io
Join Our Telegram channel to stay up to date on breaking news coverage
Source: https://insidebitcoins.com/news/loopring-price-soars-28-to-0-446-where-next-lrc