- Litecoin’s hashrate reached a new all-time high.
- The network processed its 140 millionth transaction.
- Metrics strongly suggested a bullish advantage while the technical indicators were bearish.
Litecoin [LTC] has been in the limelight for quite some time due to its increasing hashrate. Recently, a major update was revealed by the Litecoin Foundation after its hashrate reached a new all-time high (ATH) of 763.63 Th/s.
Today the Litecoin Global Hashrate hit another All Time High! pic.twitter.com/XPr0b32Ahu
— Litecoin Foundation ⚡️ (@LTCFoundation) January 9, 2023
This hashrate ATH news came amidst the hype of Litecoin’s next halving, which is scheduled to happen this year. To be precise, 205 days are left before the fourth Litecoin halving happens. After which, Litecoin’s block reward will be reduced from $12.5 to $6.25.
Read Litecoin’s [LTC] Price Prediction 2023-24
LTC is pumping!
Litecoin’s performance on the price front was also promising, as its price registered double-digit growth in the last week. As per CoinMarketCap, LTC’s price increased by more than 16%, and at the time of writing, it was trading at $82.16 with a market capitalization of over $5.9 billion.
The Litecoin Foundation also recently revealed that the network processed its 140 millionth transaction, which in itself is an achievement as it represents the reliability of the network.
Santiment’s data revealed that several of the on-chain metrics were positive, which might have played a major role in the recent price pump.
For instance, LTC’s MVRV Ratio increased considerably, which looked bullish. While LTC’s price increased, its volume also went up, reducing the chances of an unprecedented decline in the coming days.
LTC’s social volume also remained relatively high over the past week, reflecting its popularity in the crypto community. However, LTC’s velocity registered a decline, which might stop LTC’s current bull rally.
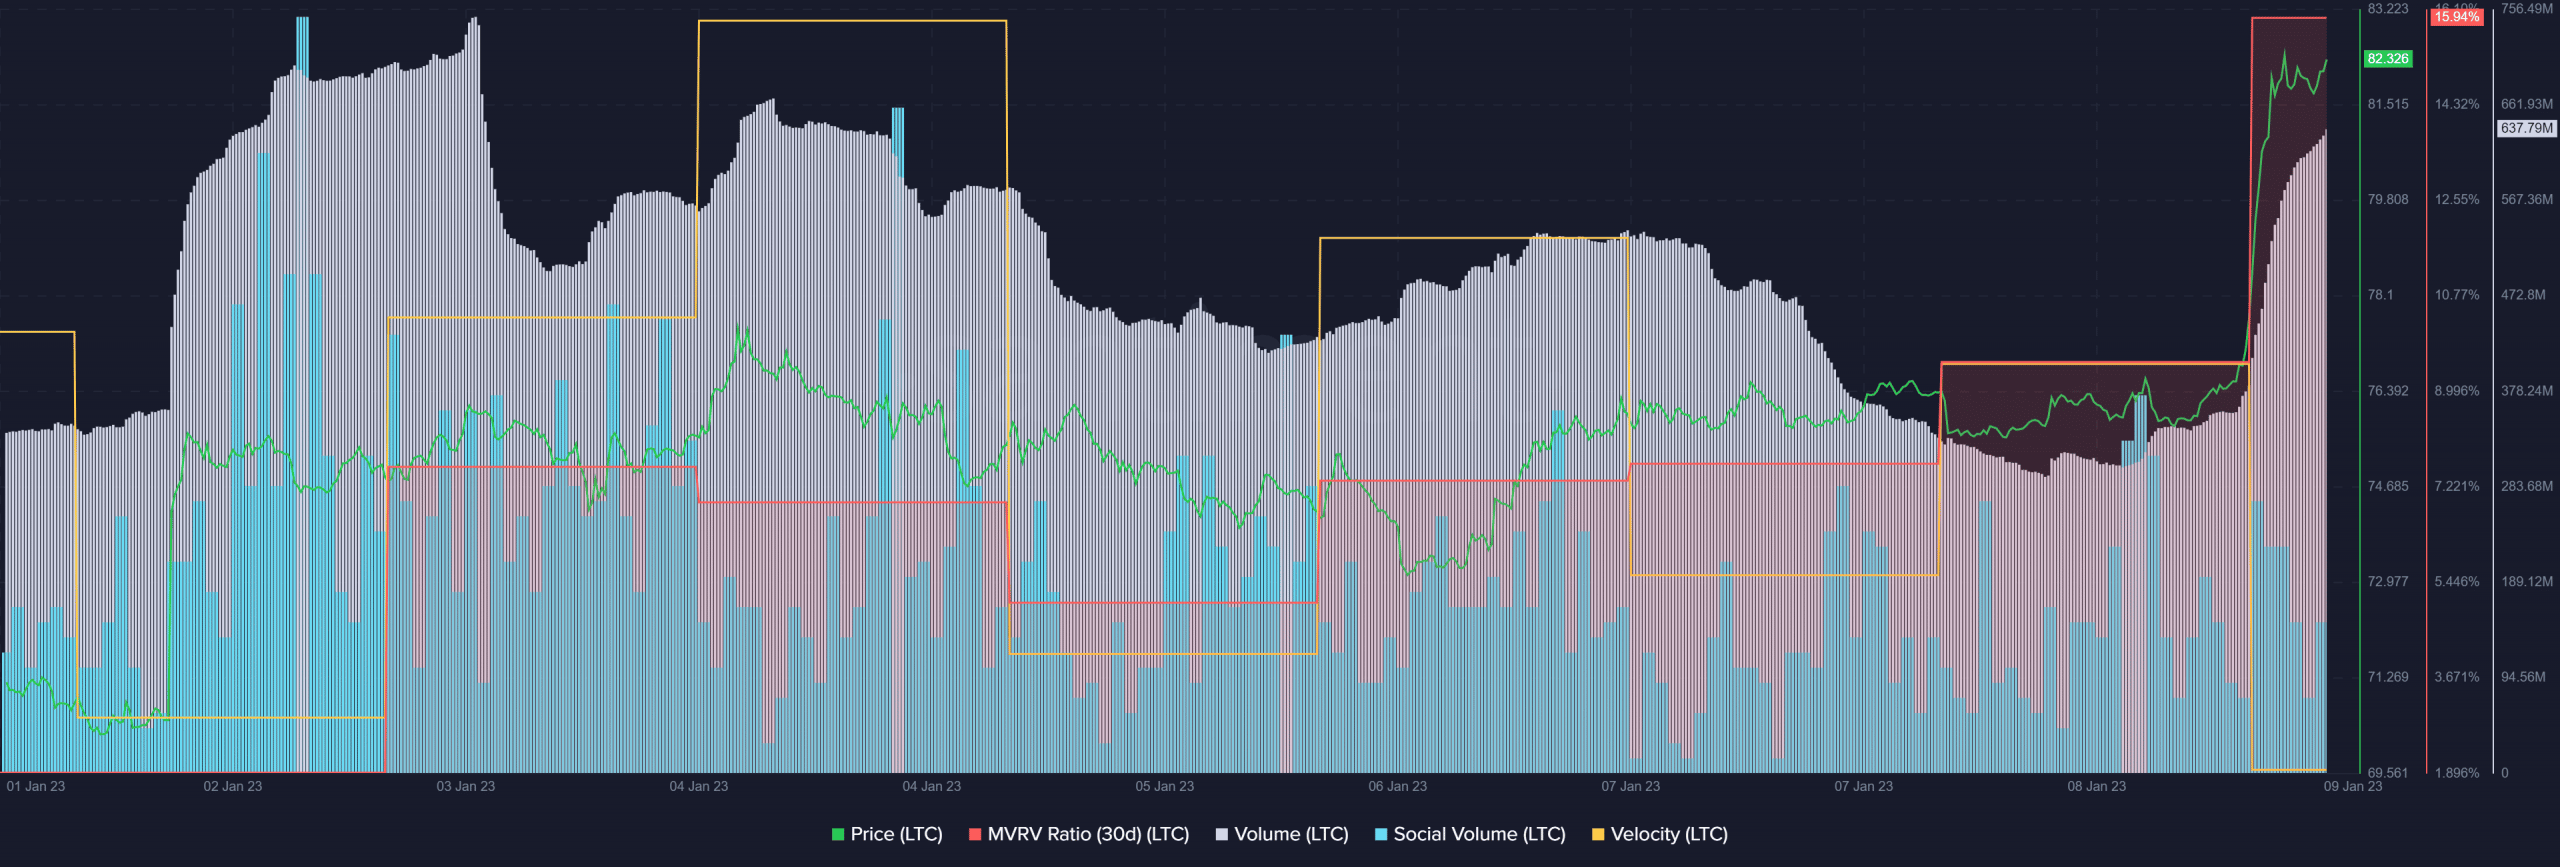
Source: Santiment
How many LTCs can you get for $1?
Hold on! Trouble around the corner
The price pump might soon get over, which can be followed by a price decline, as a few of the market indicators looked bearish on the chart.
Consider this- the Relative Strength Index (RSI) was entering the overbought zone, which might increase selling pressure and, in turn, reduce LTC’s price.
The Chaikin Money Flow (CMF) also registered a downtick. Nonetheless, the Exponential Moving Average (EMA) Ribbon revealed that the bulls still had an advantage in the market.
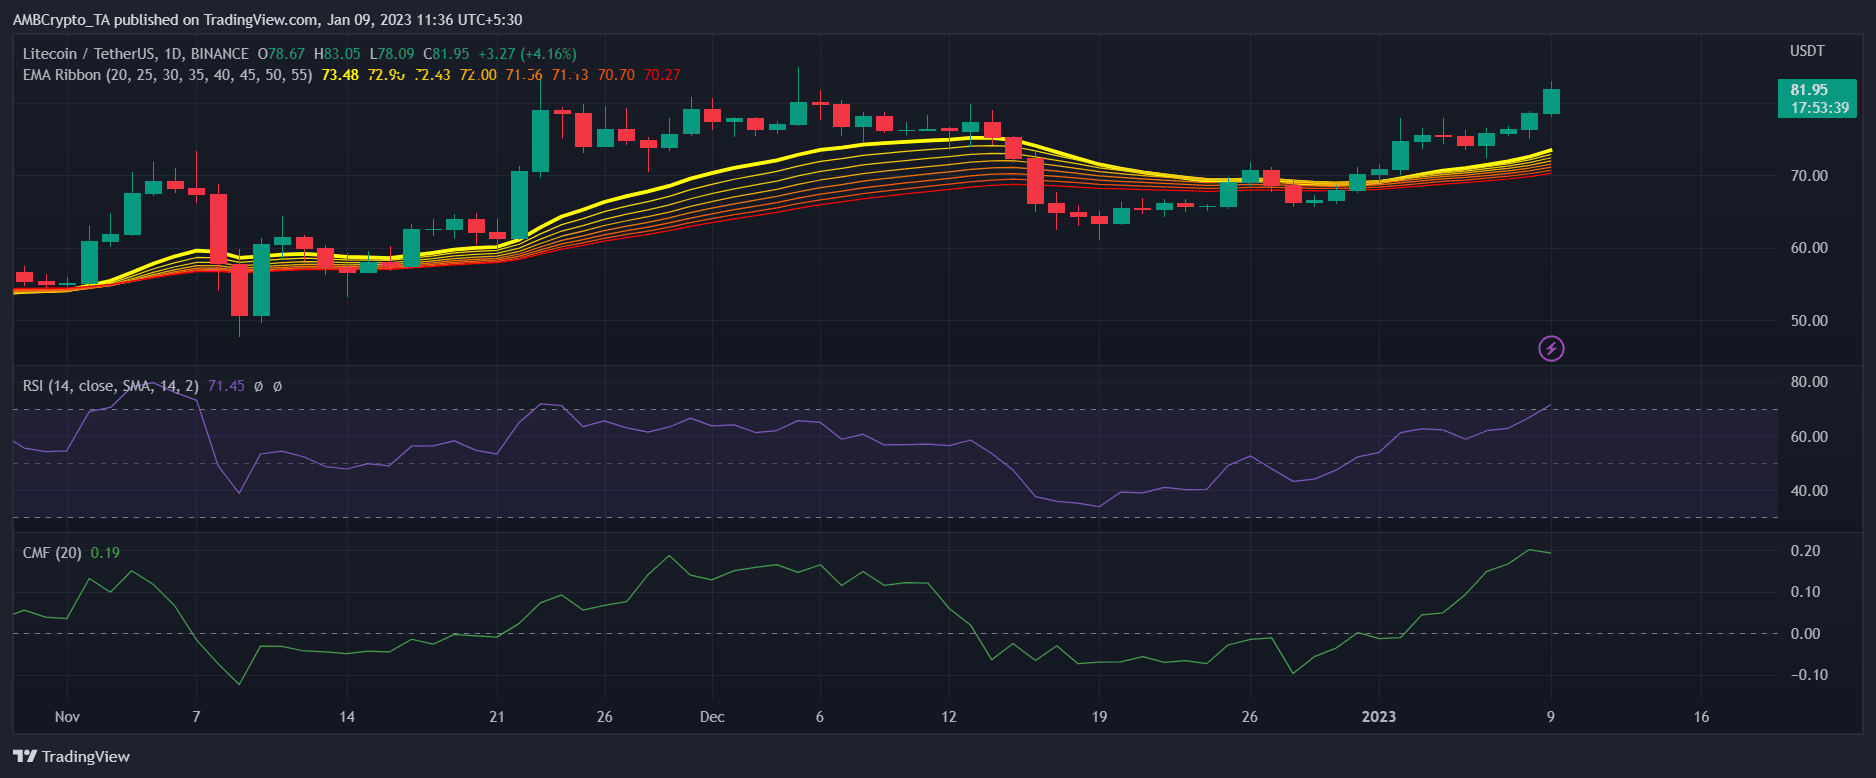
Source: TradingView
Source: https://ambcrypto.com/litecoin-hashrate-hits-another-ath-but-what-about-ltcs-price/