Disclaimer: The information presented does not constitute financial, investment, trading, or other types of advice and is solely the writer’s opinion
- The market structure was bearish for Shiba Inu despite the near 12% pump on 18 December
- Indicators showed rising volatility but the trend pointed downward
The evening, of 19 December, New York time, saw Bitcoin slide rapidly from $16.6k to $16.2k. The subsequent hours saw BTC bounce back toward $16.8k. That one hour of trading saw $11.19 million worth of long positions liquidated, according to Coinalyze data.
Read Shiba Inu’s [SHIB] Price Prediction 2023-24
Shiba Inu also dropped beneath a support level but appeared to recover. Despite the bounce, the overall trend has recently been bearish on lower timeframes. A move beneath the aforementioned support level could establish a higher timeframe downtrend as well.
The support from early November’s crash was finally broken
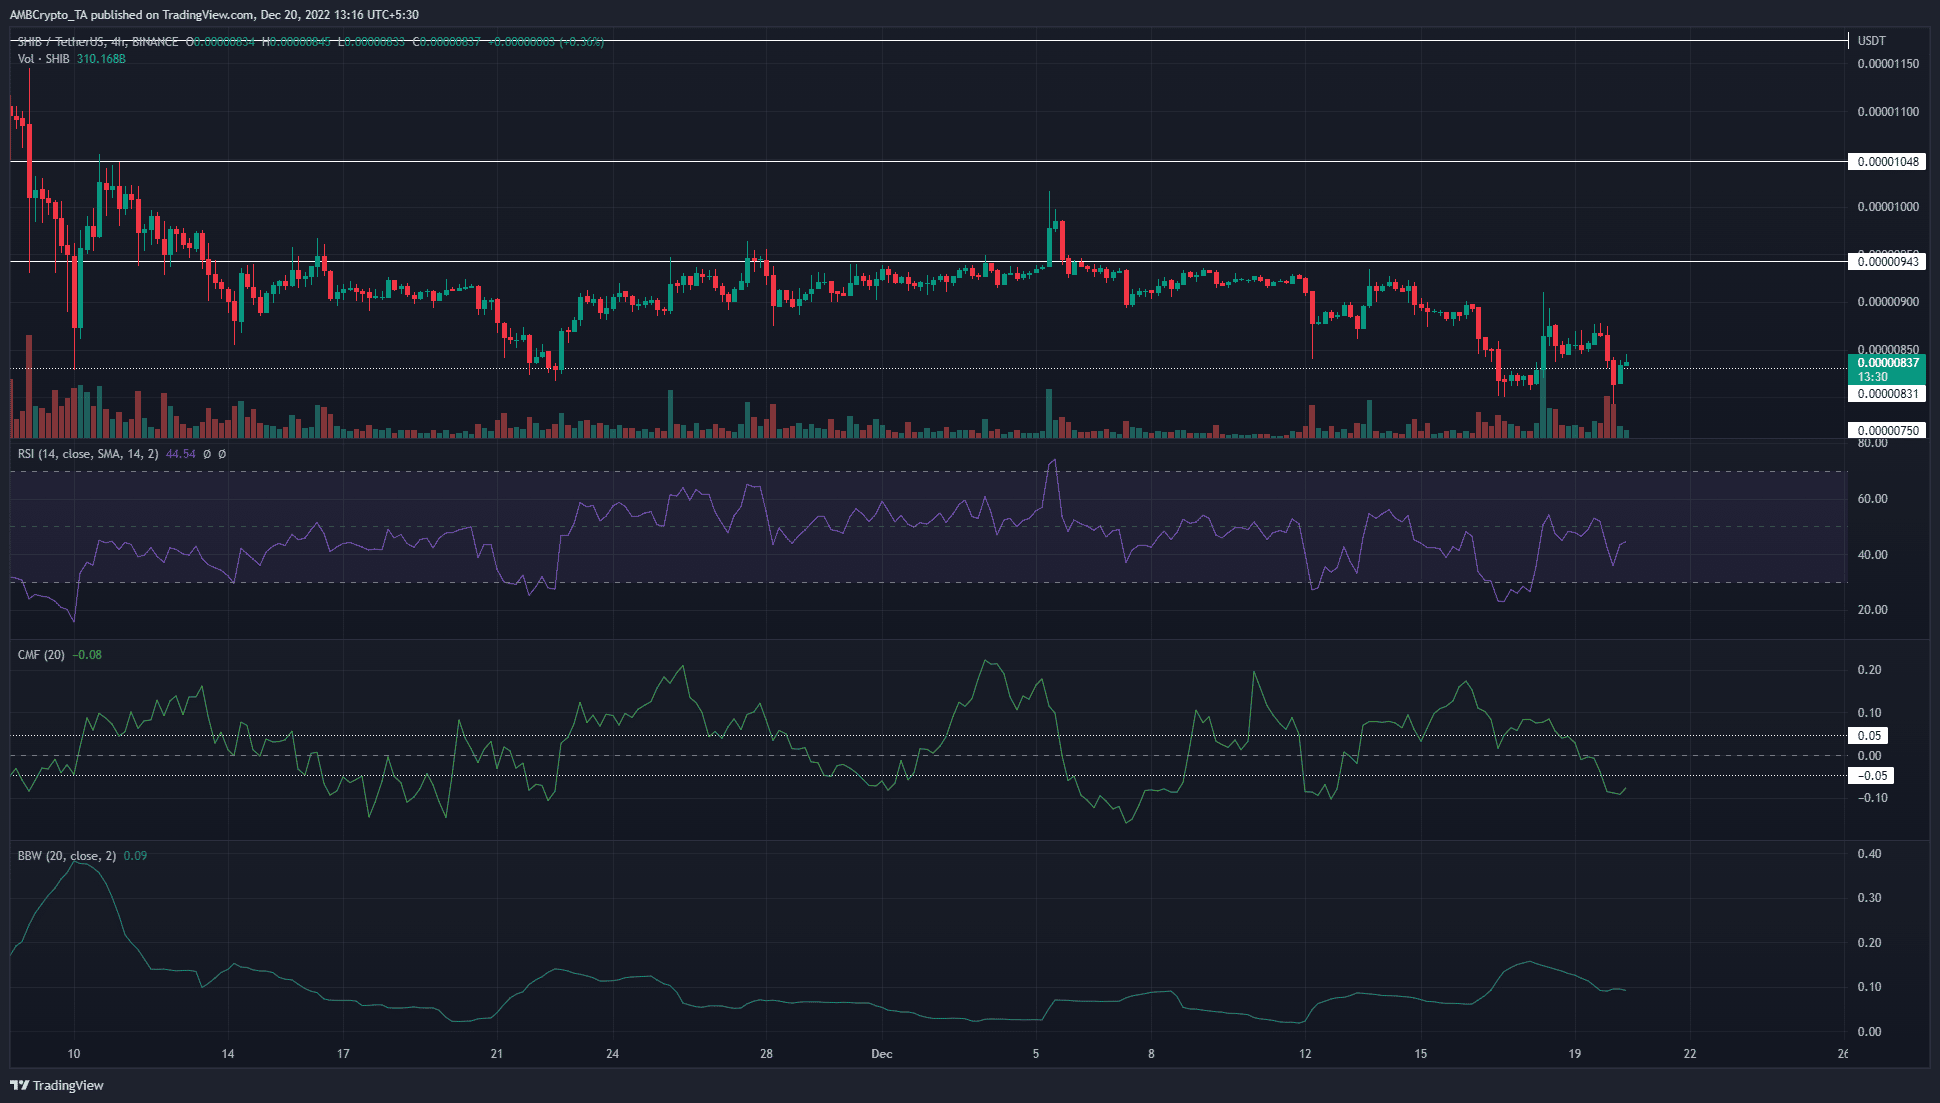
Source: SHIB/USDT on TradingView
Since 10 November, Shiba Inu bulls have valiantly defended the $0.0000083 level of support. This level was breached on the daily timeframe on 16 December. This was especially bad news because it was a higher timeframe, and it was already bearishly poised over the past month.
On 5 December, SHIB tried to rally past $0.0000094 but was unable to, and instead formed a bearish swing failure pattern on the daily chart. The move beneath the support level further reinforced the sellers’ strength.
The Relative Strength Index (RSI) has been below neutral 50 on the four-hour chart since 7 December, to show a downtrend in progress. However, the Chaikin Money Flow (CMF) registered intermittent periods of significant capital flow into the market. Meanwhile, the Bollinger Bands width indicator formed higher lows over the past week to highlight increasing volatility.
Sellers can look out for lower timeframe bounces to short SHIB and might find joy in the increased price volatility.
Open Interest told a story of fluctuating emotions in the market but neither bulls nor bears prevailed for long
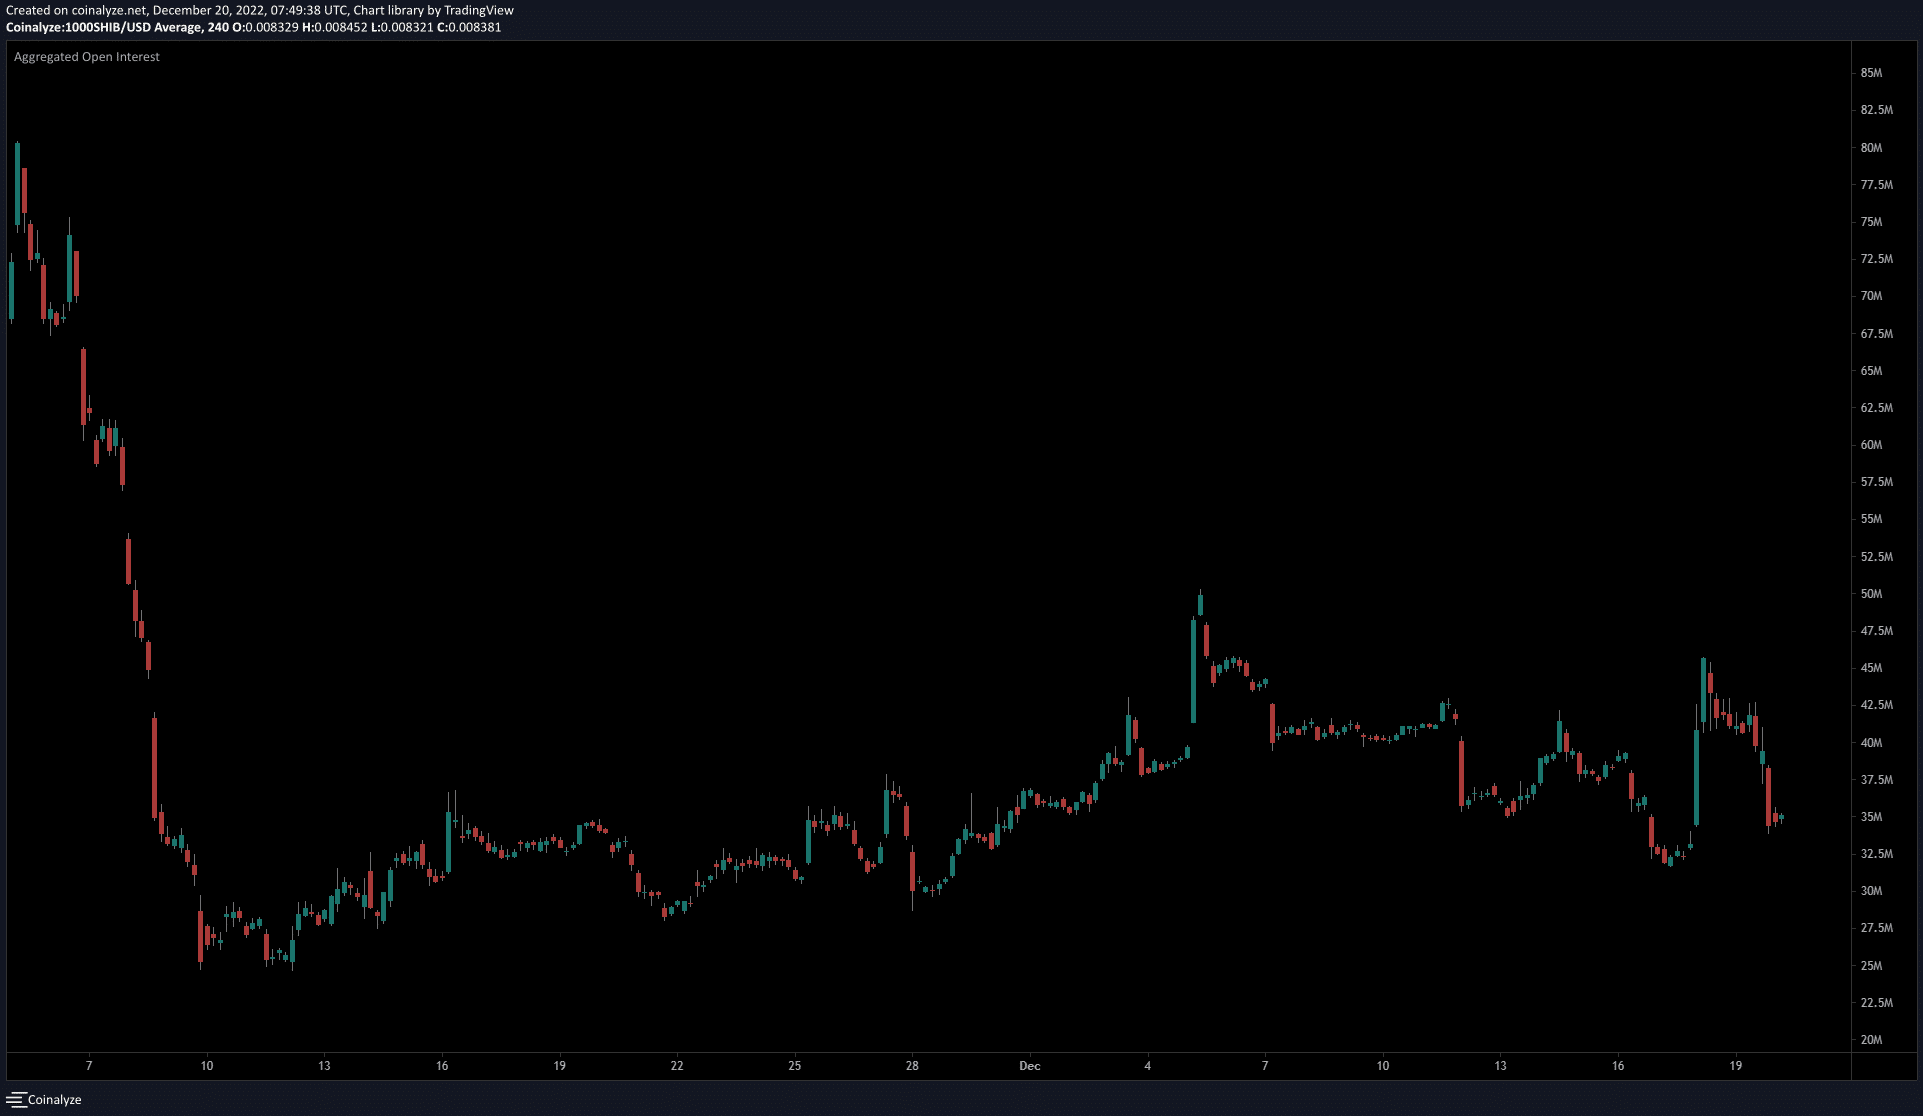
Source: Coinalyze
The Open Interest chart showed aggregated OI has been on the rise since 10 November. Over the past few days Open Interest has taken wild swings.
Price surges on 5, 13, and 18 December were followed by an advance in OI. These rises were quickly wiped out as traders cashed in on their moves, or over-enthusiastic bulls or bears saw significant liquidations.
At press time, the market structure was bearish, and the futures market also showed bearish sentiment.
Source: https://ambcrypto.com/here-is-what-shiba-inu-traders-can-expect-after-the-recent-liquidity-hunt/