Join Our Telegram channel to stay up to date on breaking news coverage
Frax Share price rose 15% in the last 24 hours to escape from a descending triangle as the crypto market flashed green on Thursday. FXS might maintain the bullish momentum if it clears the barrier at $12.
Let’s analyze the price action after yesterday’s recovery and see what factors could lead to a possible continuation of the uptrend in the near future.
1. FXS Trades Above A Significant Demand Zone
Frax Share bulls started a recovery wave on February 6 taking the price 45% to the $14.25 high. The buyers tried to keep FXS above $14, but they were rejected at around $14.30, initiating a 30% decline toward the $9.63 support floor. At the time of writing, the altcoin was still trading below $14.
Bulls had pushed the price out of a descending triangle chart pattern confirming a bullish breakout. This move has also taken FXS above an important demand area stretching from $9.63 to $10.91. Buyer congestion in the said zone is likely to provide the tailwinds required to propel the Frax Share price above the $14 resistance level. Such a move would represent a 27% climb from the current price.
FXS/USD Daily Chart
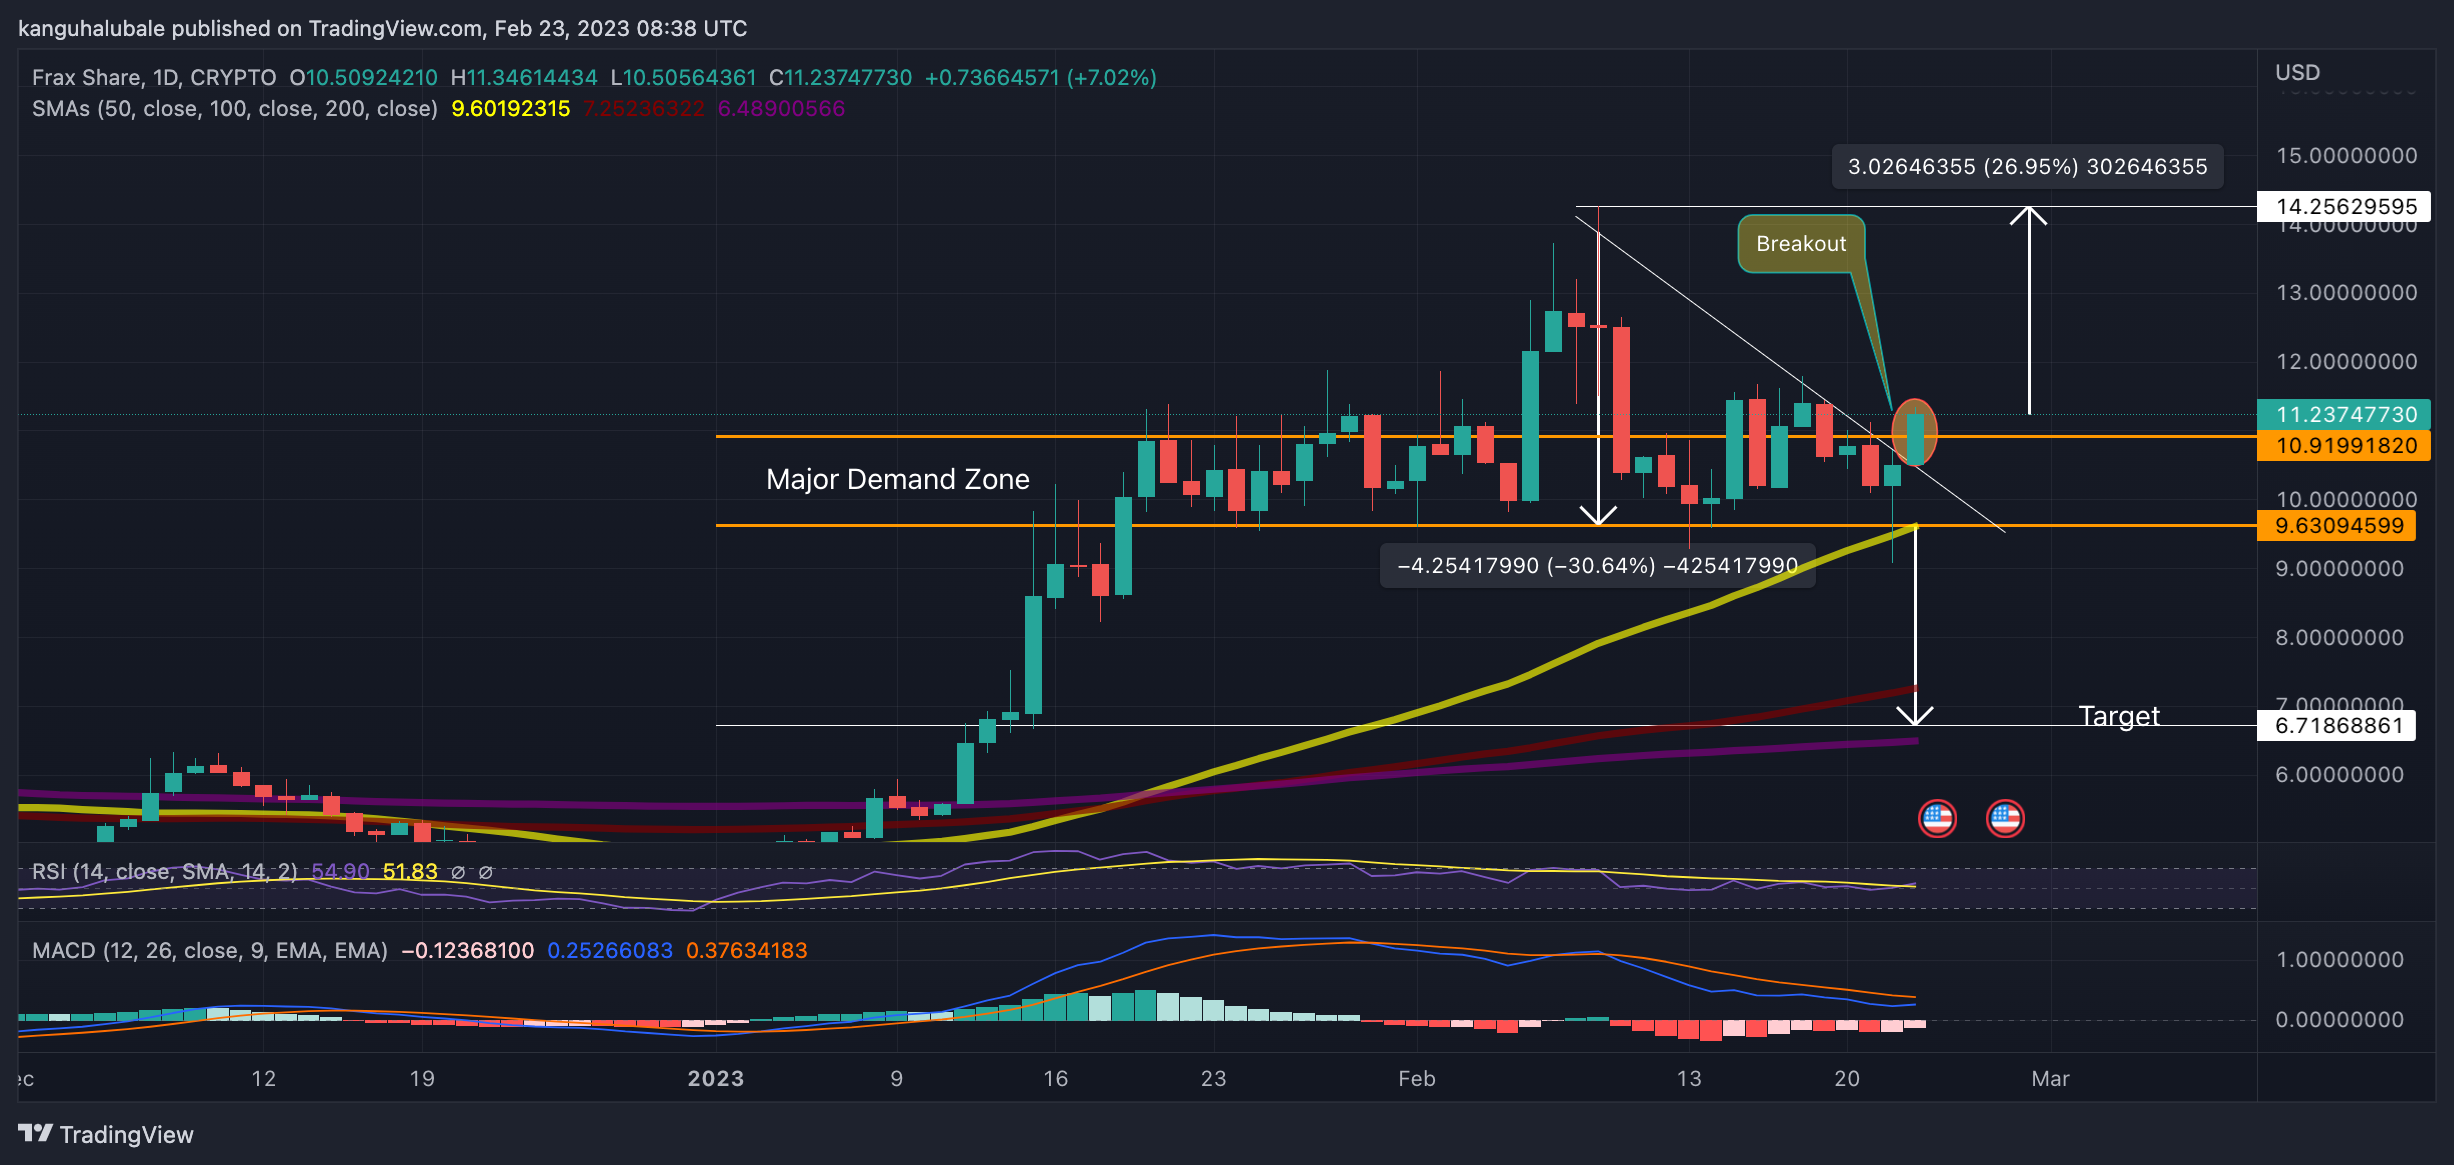
The Relative Strength Index (RSI) was moving upwards away from the negative region suggesting that the bulls had begun to take control of the price. The price strength at 54 suggested that the buyers had begun taking control of the Frax Share price, adding credence to the bullish outlook.
Moreover, the Moving Average Convergence Divergence (MACD) indicator was moving in the positive region above the zero line. This suggested that the market conditions still favored FXS’s upside.
2. On-Chain Metrics
The daily chart above showed that Frax Share was trading above key support areas. These included the immediate support levels from the $11 and $10 psychological levels. Further down, bears would be confronted by buying pressure from the lower limit of the demand zone at $9.63, embraced by the 50-day Simple Moving Average (SMA), the 100-day SMA at $7.25, and the 200-day SMA at $6.4.
This was supported by on-chain metrics from IntoTheBlock’s In/Out of the Money Around Price (IOMAP) model, which showed that FXS sat on relatively robust support. For example, part of the demand zone described above lies within the $10.59 and $10.91 price range, where approximately 5.93 million FXS were previously bought by roughly 670 addresses.
Frax Share IOMAP Chart
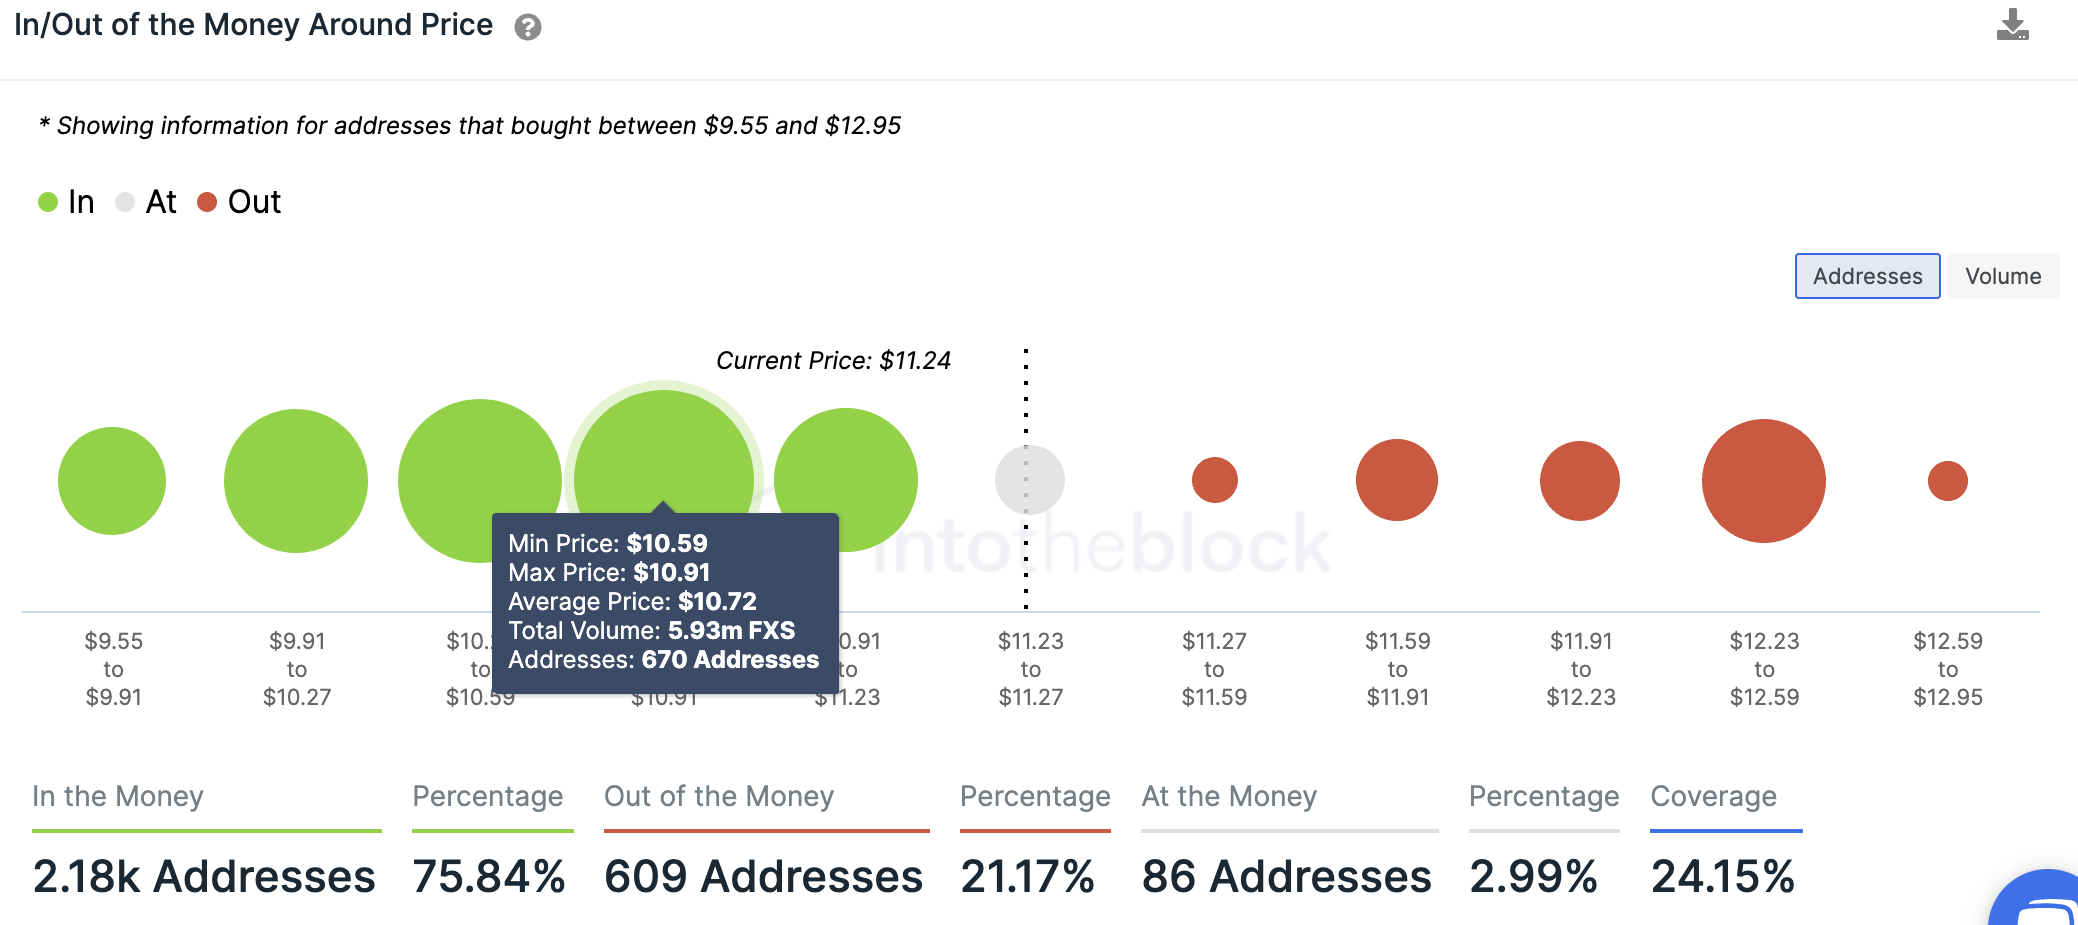
Any attempt to push the price below the said level would be met by buying from these investors who may want to increase their profits. The ensuing demand pressure would cause the price to rise even higher.
3. Increasing Total Value Locked
Further validating the positive outlook for Frax Share was data on the total value locked (TVL) on the fractional-algorithmic stablecoin protocol that revealed a bullish bias from stakers. An analysis of TVL data helps traders to measure the overall health of the Frax Share protocol in order to make important decisions.
The more value locked into protocols, the more active the ecosystem is. It can be used to assess the riskiness of the ecosystem, as it provides a way to measure the total value at risk.
Total Value Locked On Frax Share
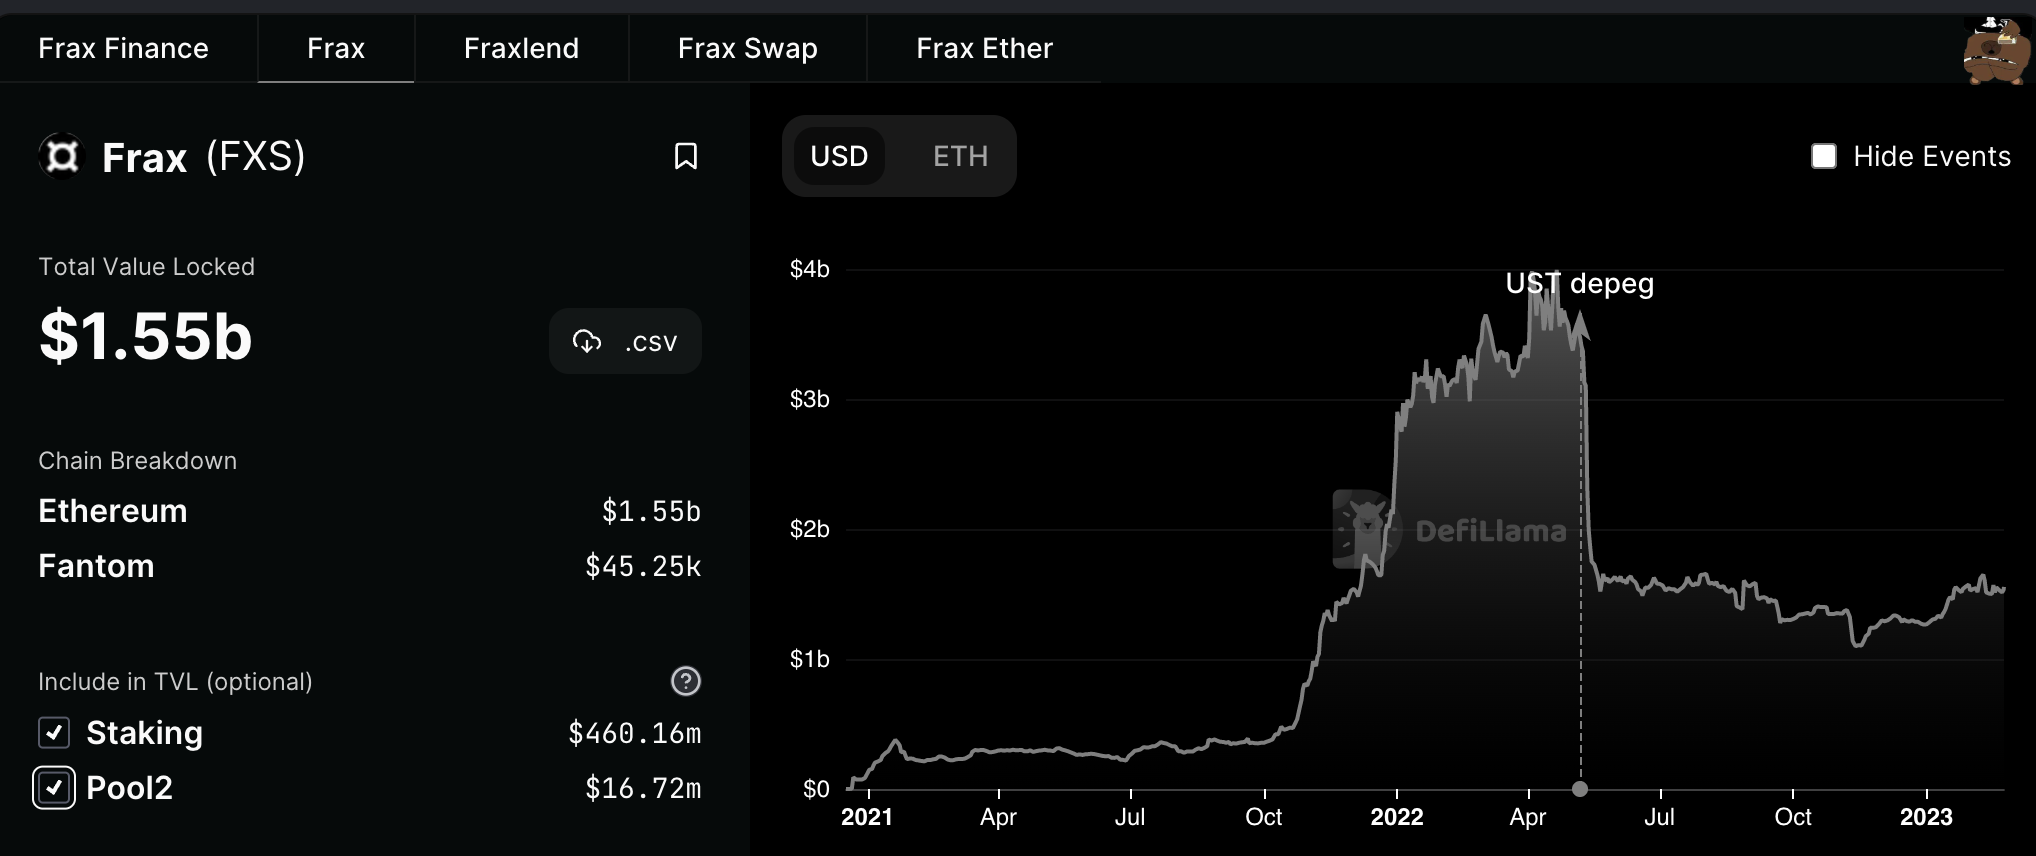
According to the chart above, there is clear evidence that the total value locked on Frax Share has been increasing over the last few days. The data from DeFiLlama, a DefI TVL aggregator, shows that the protocol’s TVL rose from $1.5 billion on February 14 to the current value of $1.55 billion.
This increase in TVL is deemed bullish as it signals an increasing trust amongst investors.
The Flip Side
Things could go awry if FXS turns down from the current levels, sliding past the upper limit of the demand zone at $10.91 and back into the triangle. This would put the price at risk of dropping further to reach the target of the bearish technical formation at $6.71. Note that this is only possible if the price drops below the triangle’s horizontal line at $9.63.
Read More:
Fight Out (FGHT) – Newest Move to Earn Project

- CertiK audited & CoinSniper KYC Verified
- Early Stage Presale Live Now
- Earn Free Crypto & Meet Fitness Goals
- LBank Labs Project
- Partnered with Transak, Block Media
- Staking Rewards & Bonuses
Join Our Telegram channel to stay up to date on breaking news coverage
Source: https://insidebitcoins.com/news/frax-share-price-prediction-as-fxs-escapes-from-a-bearish-triangle