The price of DOGE recently witnessed a significant surge, and witnessed an upswing by more than 150%. As seen on the daily timeframe price chart of the token from Tradingview, this resulted in a substantial amount of buy pressure. This in turn prompted the price to increase further.
However, other measures suggested that this trend might be ending soon as a price reversal might be in the works.
_____________________________________________________________________________________
Here’s AMBCrypto’s Price Prediction for Dogecoin [DOGE] for 2022-2023
______________________________________________________________________________________
MVRV depicts profit, but there is a catch
The token was over 30% when the 30-day Market Value to Realized Value ratio (MVRV) was examined. Investors who had purchased the token within the previous 30 days were in the black thanks to an MVRV ratio of above 30%. Additionally, it was possible to see that the MVRV ratio chart had begun to trend downward. This may be considered as a sign of a potential reversal in profitability.
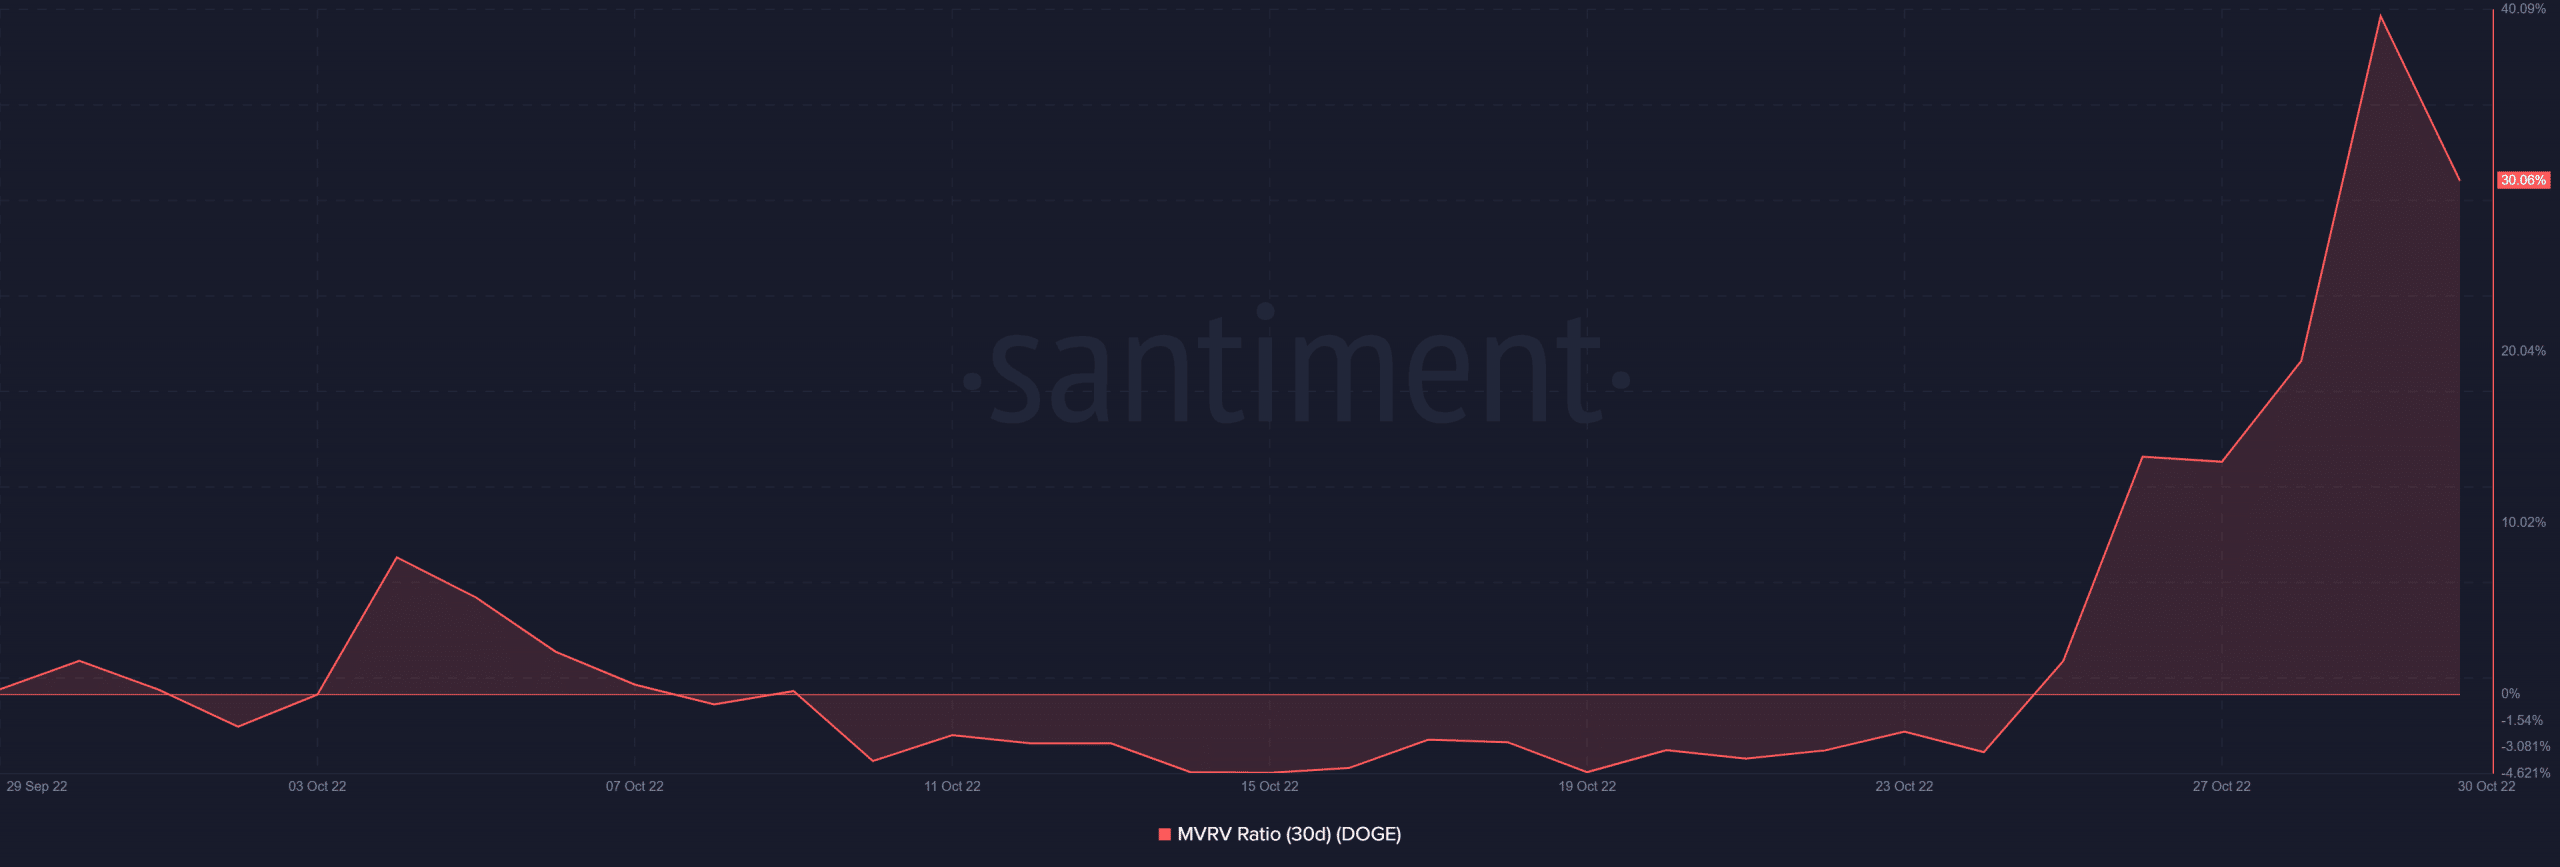
Source: Santiment
Additionally, a check at the same MVRV ratio over a 365-day period revealed encouraging results for the coin. The metric was also seen to be higher than 31%. The shift into the profitable range was seen to have begun around 28 October, which was also the day Elon Musk announced his takeover of Twitter.
The MVRV observation zone and the starting point of the upward movement meant that DOGE holders were beginning to see profits after more than a year. However, a negative inflection was evident, just as it was in the 30-day MVRV ratio. This suggested that profitability was declining.
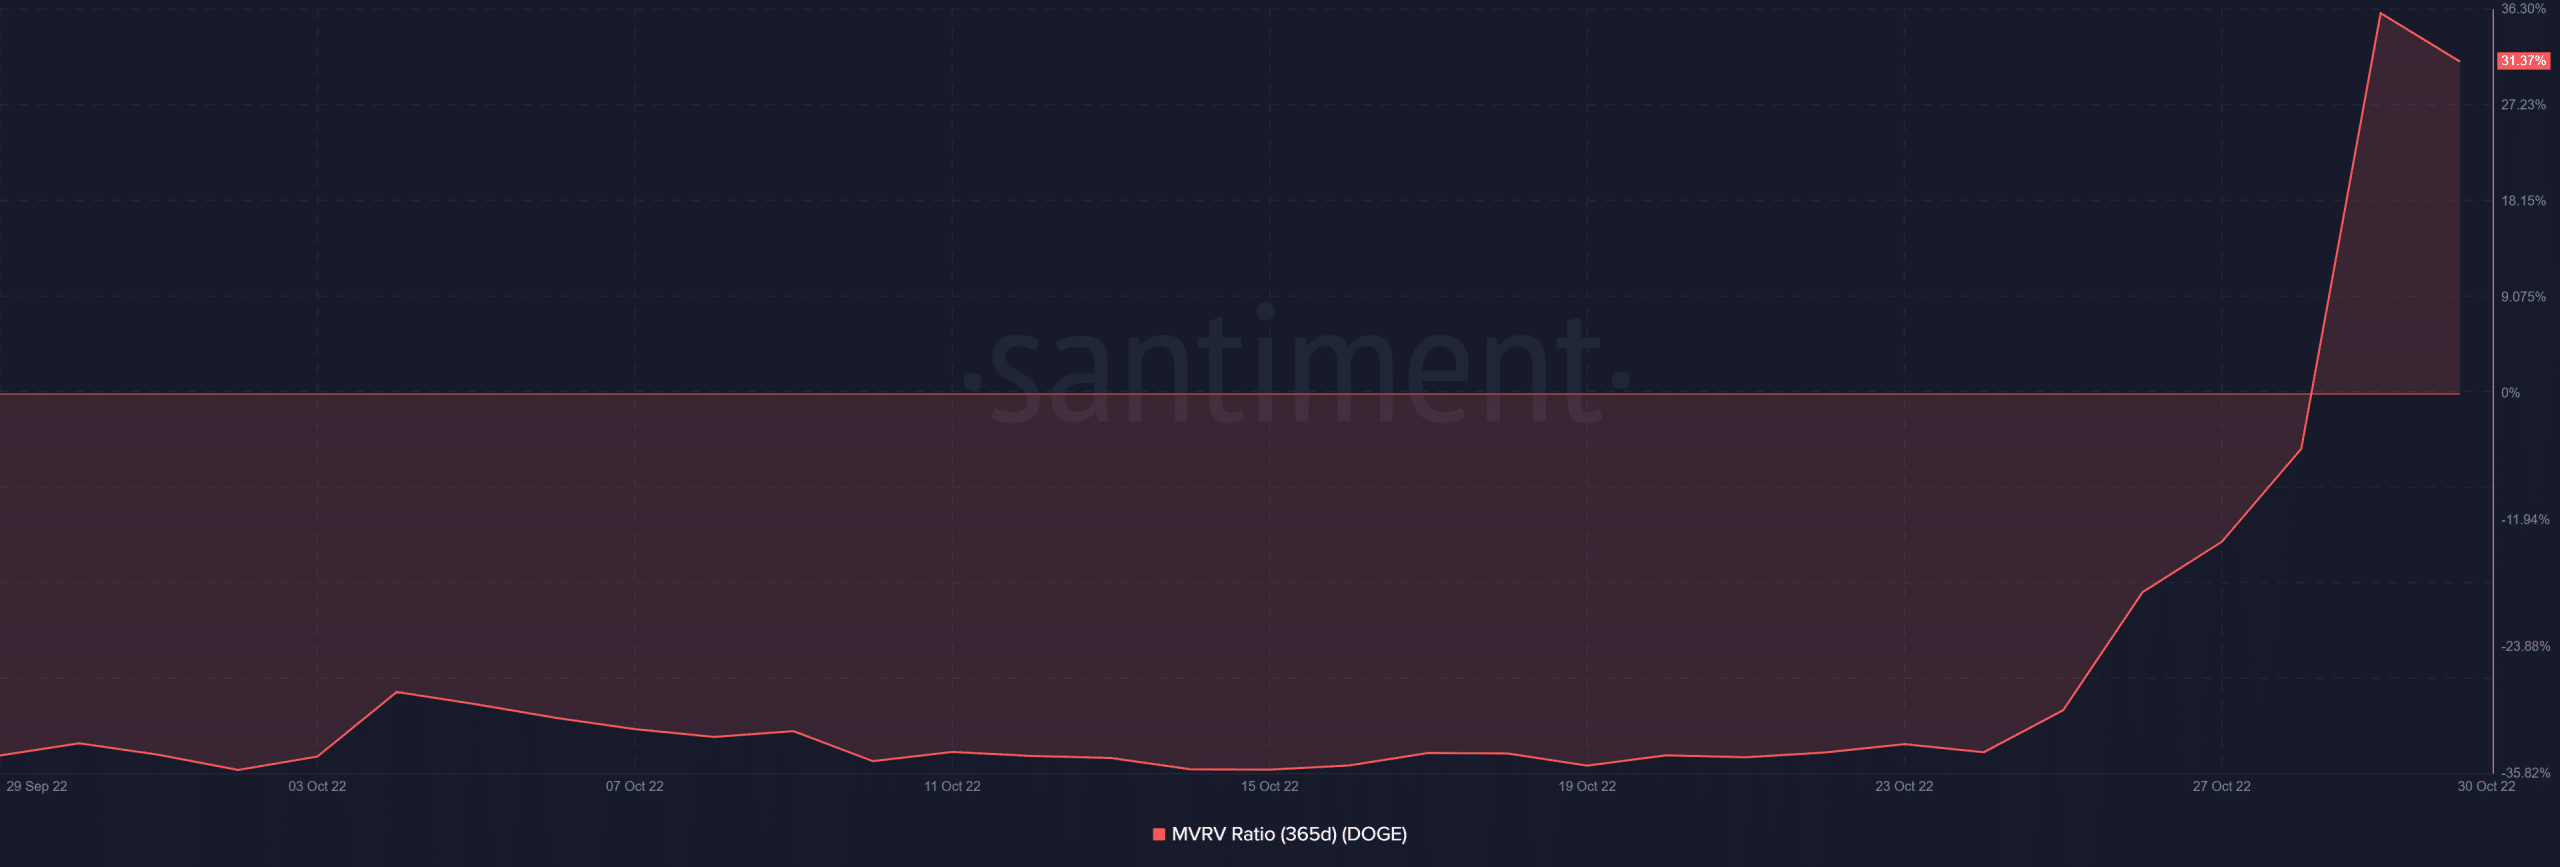
Source: Santiment
DOGE’s moves point towards some caution
Despite all the generally encouraging indicators regarding DOGE‘s price, prospective investors may proceed with caution going forward.
A review of the DOGE price action on a daily time frame revealed that the token had climbed by more than 158% during the last couple of days. A gradual increase could be observed up until 29 October when it soared close to 50% in a single trading period.
This might be categorized as a parabolic move because there was no significant event other than speculations. A parabolic move, either upward or downward, is usually considered unusual in a price move. Furthermore, a reversal almost always happens after such a move.
The token had clearly broken into the overbought zone, as seen by an assessment of the Relative Strength Index (RSI). The On-Balance Volume (OBV) also suggested a surge in buy pressure, which may be used to further confirm the overbought condition.
A price reversal was imminent, according to the RSI line’s placement in that area. DOGE dropped down from $0.12, where it had risen to, on 29 October, to a trading range of $0.11 as of this writing.
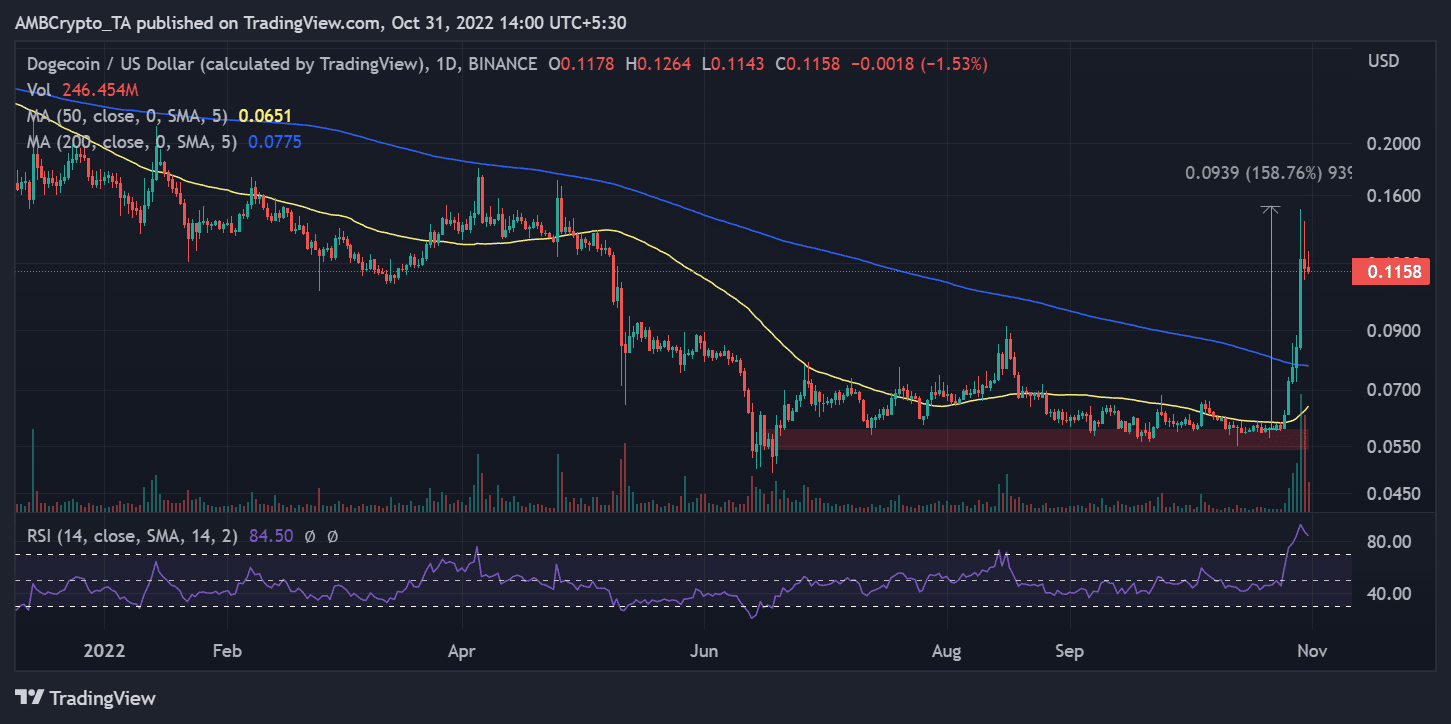
Source: TradingView
The DOGE price fluctuation that was visible was mostly the result of speculative activity. Typically, increases like these are not sustainable, and all the metrics were showing that a price action reversal was imminent. This included even metrics that indicated a positive sentiment.
Old investors might wish to sell their holdings now for a profit because a downward trend could develop. This may not always be the optimal time for new investors to purchase the token.
Source: https://ambcrypto.com/doge-may-touch-the-moon-only-to-crash-leaving-investors-in-this-bewildering-state/