The year 2021 was considered to be the year of memecoins as they took the crypto market by storm. During that time, Shiba Inu recorded the most gains, resulting in it rewarding its investors with massive gains within a short period.
Over the past few months, the interest of investors has displayed a switch towards mid-cap and low-cap memecoins, highlighting a rise in the inflow of digital assets in this category. As the market displayed a significant uptrend last year, meme coins recorded a massive jump, with the Bonk token recording the highest surge of over 100x Year-on-Year (YoY).
The market valuation of memecoins may experience constant fluctuations, but the popularity of these crypto tokens records a rise each day, highlighting a vast number of investors constantly looking out for these coins.
Dogecoin And Shiba Inu Price Sentiments:
The DOGE price started trading in the year 2024 in a closed range between $0.08931 and $0.09366 for a while. As the market volatility increased, the star memecoin recorded a loss of approximately 15% in valuation within a day.
Following this, the memecoin traded in a consolidated range between $0.07597 and $0.08416 for about a week. The bulls attempted a breakout, but the bears overpowered the bulls, resulting in a pullback within the range. After this, the price continued trading sideways for a brief period.
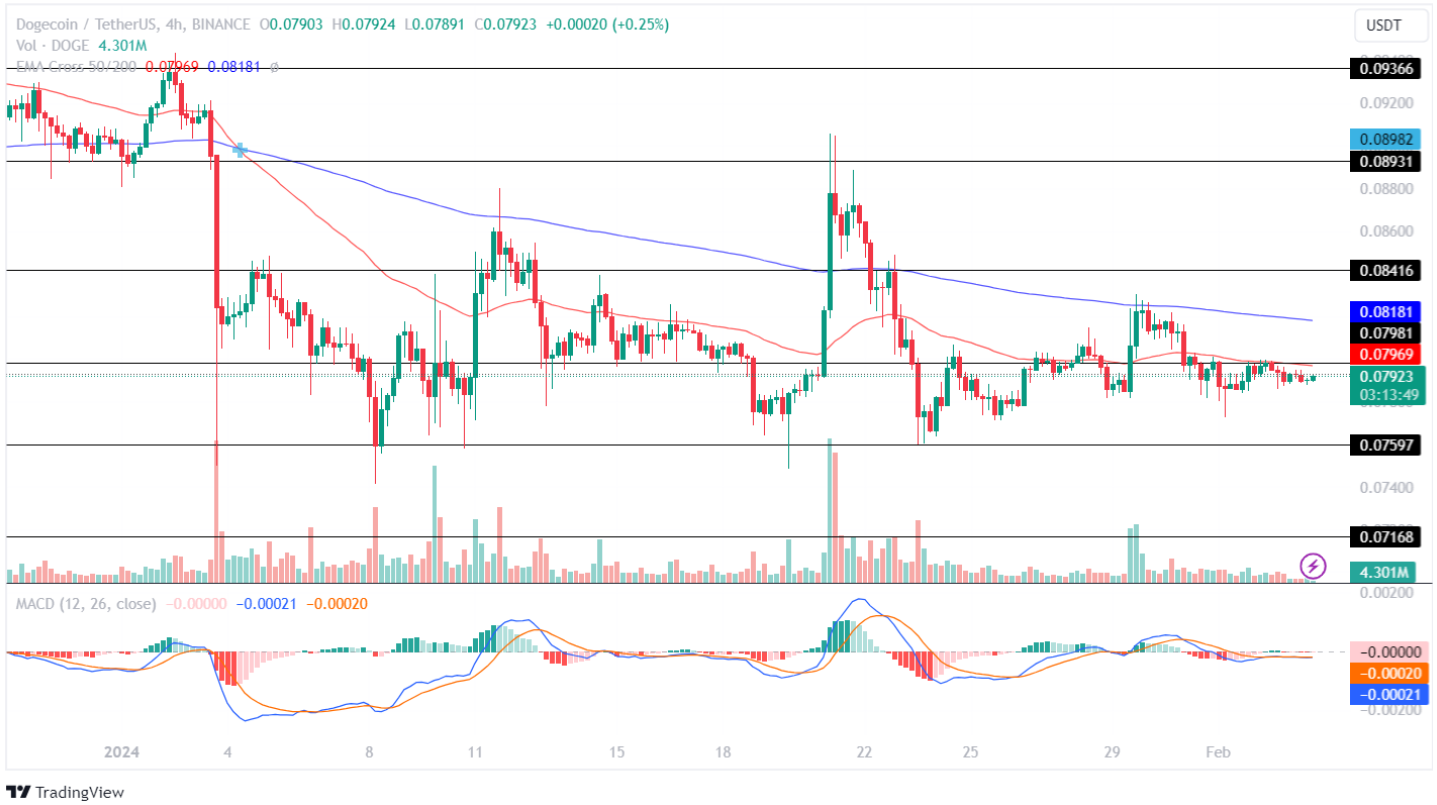

After multiple attempts, the bulls successfully broke out the resistance level of $0.08416, but the rally was short-lived and the price experienced another pullback in the chart. Since then, the price has been trading between $0.07597 and $0.08416, indicating a weak price action for the coin.
The technical indicators show a neutral trend, highlighting an uncertainty in the future price action of the coin. Moreover, the 50-day EMA acts as a resistance to the price chart, indicating a bear power in the market.
Shiba Inu Price Sentiment:
The Shiba Inu price followed in the footsteps of the category leader and started trading the year sideways. As the market lost momentum, the SHIB coin price recorded a correction of over 12% in valuation. Following this, the price traded between $0.00000926 and $0.00001006 for over a week.
The bulls attempted a breakout but the rally was short-lived, resulting in a pullback by the bears within the range. The bulls constantly struggled to hold the price above the support level, but after multiple attempts, the bulls lost momentum and the price broke down its support level at $0.00000926.
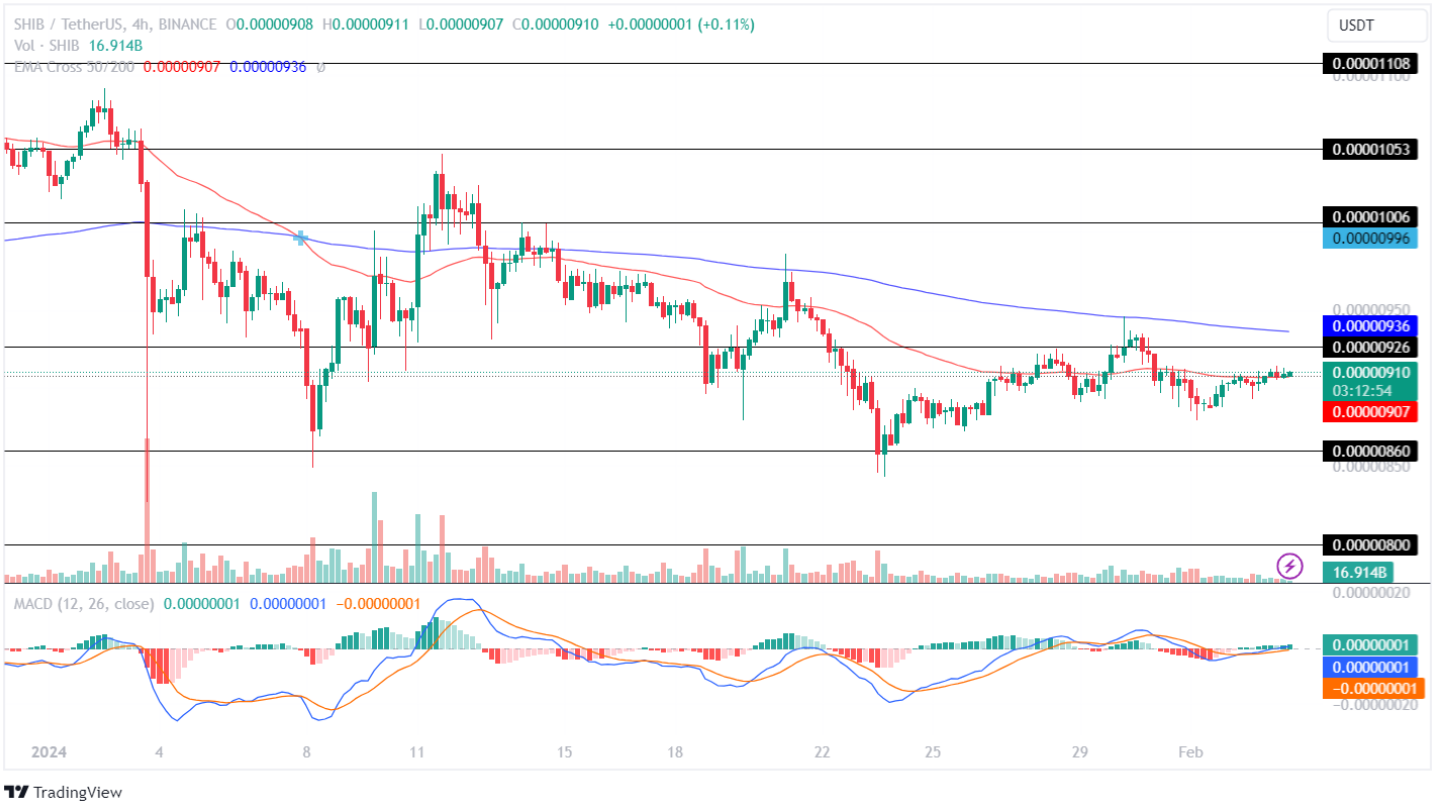
Since then, the price has been trading in a closed range between $0.00000860 and $0.00000926, highlighting a weak buying and selling pressure for the coin in the market.
The price sentiments hint at a mixed sentiment as the Moving Average Convergence Divergence (MACD) shows a constant rise in the chart, suggesting an increase in the buying pressure. Conversely, the Cross EMA 50/200-day records a neutral trend with a 50-day average acting as a resistance to the price.
Solana Ecosystem:
The Solana ecosystem has recorded a massive jump of over 800% over the past year, resulting in it claiming the fifth-largest spot on the cryptocurrency list by market cap.
The SOL price started the year 2023 on a neutral trend and continued to display minor fluctuations till Q3. However, the price recorded a significant recovery during the last trading months by multiplying its value over five times.
Solana Based Memecoin:
The BONK memecoin recorded the highest gains in the year 2023 with a jump of over 10,000% (100X). During the last trading month of the year, the Bonk token traded between $0.000005568 and $0.000009635 for the first week. As the market volatility grew, the meme coin jumped over 129% within the next few days.
After this, the price traded sideways for a while, following which the bulls regained momentum, and the price recorded a jump of approximately 230% within days. After facing rejection at $0.000031786, the bulls lost momentum and recorded a loss of 46.907% in valuation. The Bonk token then traded in a closed range between $0.000016876 and $0.000021792 for over a week.
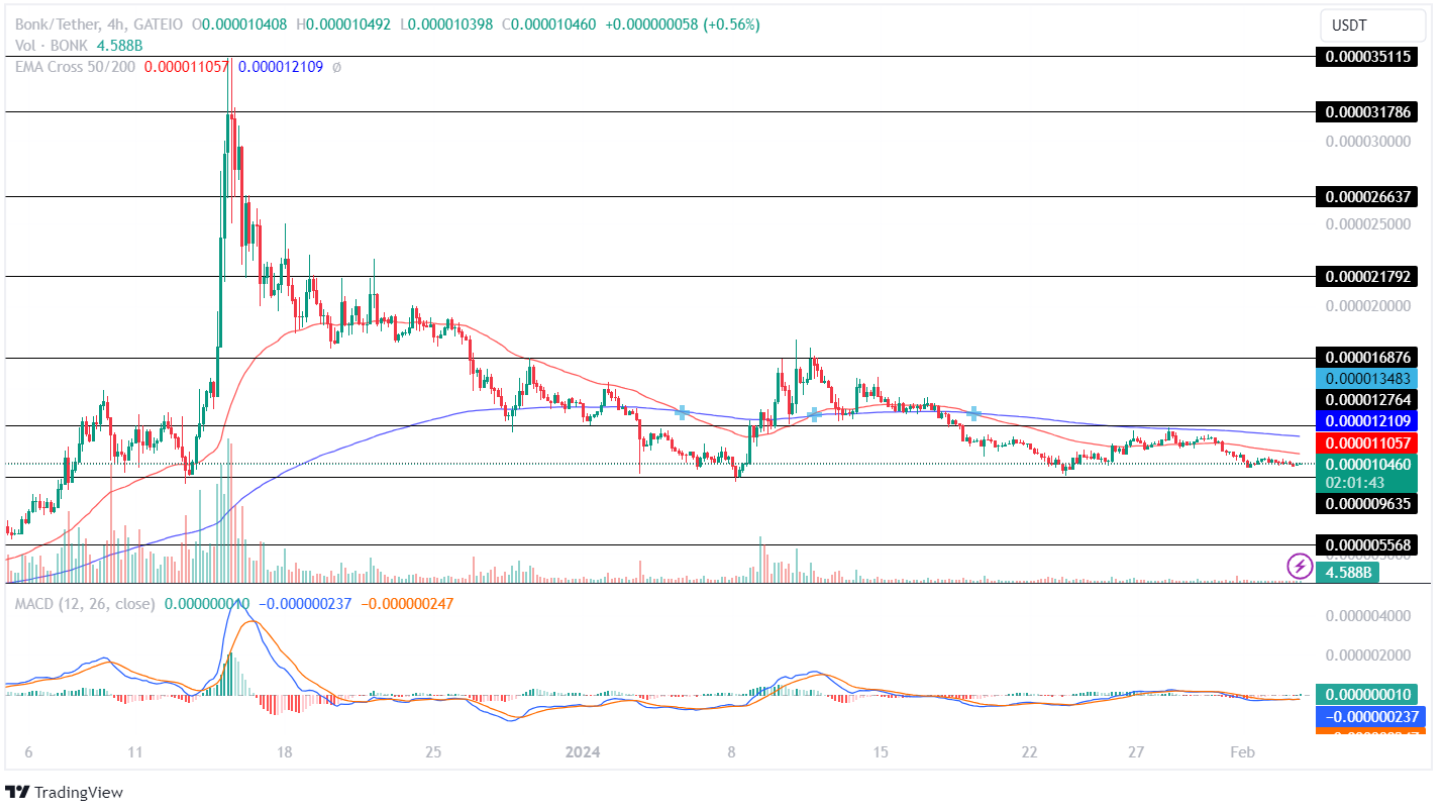
As the market volatility increased, the price started trading under a bearish influence, resulting in it forming a descending channel pattern. After trading close to its important support level of $0.000009635 for a while, the bulls regained momentum and successfully broke out where the price traded sideways for a brief period.
After this, the Cross EMA displayed a Death Cross, resulting in the losing momentum and breaking down. Since then, the price has been moving sideways in a closed range.
The technical part shows a mixed sentiment as the MACD records a bullish convergence, suggesting the price will experience a significant uptrend in the coming days. Conversely, the Cross EMA 50/200-day acts as a resistance to the price chart, highlighting a bearish influence in the crypto space.
Conclusion:
Overall, the Meme coin category has recently displayed a massive price action, with some gaining and some losing significant valuations in their respective prices. However, this category is highly volatile, and the price action is highly influential to several factors.
This category is prone to recording the highest probability of pump-and-dump situations. It is best suggested to Do-Your-Own-Research (DYOR) and, most importantly, keep a stop-loss before making any investments in this particular category as it is known for displaying massive price movements within a short period.
Source: https://coinpedia.org/price-analysis/this-meme-coin-targets-1-billion-milestone-can-it-outperform-doge-shib/