- BONK price skyrockets to an all-time high of $0.00000477.
- Amid soaring demand, BONK’s price and market cap surge, but technicals suggest a possible pullback on the horizon.
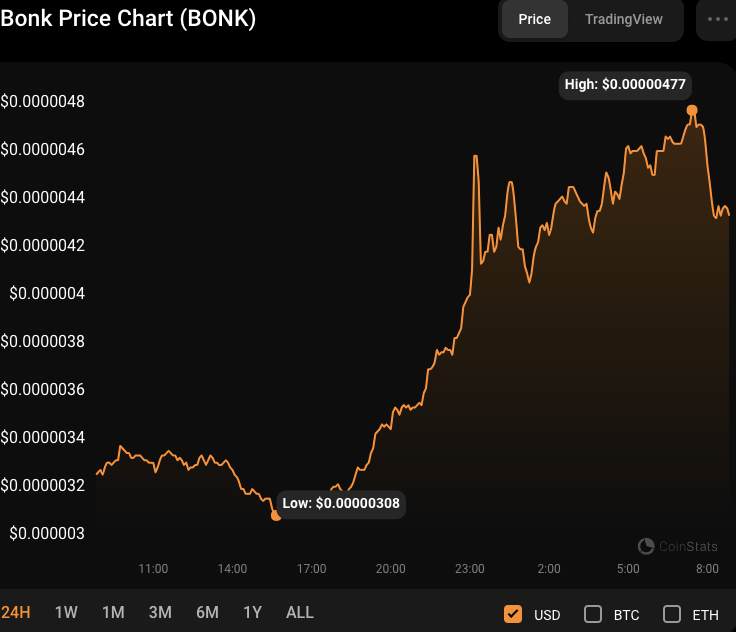
- BONK’s rally halted at $0.00000477 as indicators like RSI hint at overbought conditions and potential market reversal.
After a bull-bear battle for control in the Bonk (BONK) market in the early hours of the day, support was established at the intra-day low of $0.00000308. This support level attracted buyers who considered it a chance to join the market at a low price. Consequently, the price rebounded, skyrocketing the BONK price to an all-time high of $0.00000477, where it met resistance from sellers trying to grab gains.
At press time, BONK was trading at $0.00000457, a 34.2 % increase from the day’s low, indicating robust demand, according to Coinstats. Significantly, BONK’s market capitalization and 24-hour trading volume increased by 35.81% and 106.17%, respectively, to $240.32 million and $104.6 million.
This increase in market capitalization and trading volume suggests investors are becoming more interested in BONK. Furthermore, the increasing buying pressure and optimistic mood indicate that the price of BONK may shortly continue to rise. If this bullish momentum breaks over the $0.00000477 barrier, the next level to watch out for is $0.00000500. This milestone may entice additional buyers, pushing the price of BONK higher.

However, if the bears grab control and the price of BONK fails to break past the $0.00000477 barrier, the market may see a short consolidation or retreat. In such a case, investors should keep a close eye on the $0.00000420 support level, as a break below it may suggest a change in market sentiment and likely more bearish action for BONK.
BONK/USD Technical Analysis
The bulging motion of the Bollinger bands on the 4-hour price chart, with the upper and lower bands reaching $0.0000044657 and $0.0000019986, respectively, indicates that BONK is experiencing solid volatility and the possibility of a breakout.
However, the price action produces a red candlestick on the 4-hour price chart, signaling that a retreat or reversal is imminent. This pattern shows that BONK’s bullish momentum is fading, shifting the market mood.
Furthermore, the Relative Strength Index (RSI) of 70.24 suggests that BONK is now in an overbought region, which might support a possible downturn or reversal occurring soon. This pattern implies that buying pressure in BONK has reached a breaking point, and traders may begin taking gains or selling their holdings.
In conclusion, BONK’s surge to new heights amid volatile market conditions hints at opportunity and caution, with key indicators signaling potential shifts ahead.
Disclaimer: The information presented in this article is for informational and educational purposes only. The article does not constitute financial advice or advice of any kind. Coin Edition is not responsible for any losses incurred as a result of the utilization of content, products, or services mentioned. Readers are advised to exercise caution before taking any action related to the company.
Source: https://coinedition.com/bonk-price-soars-to-all-time-high-is-a-correction-looming/