The Huobi token (HT) price witnessed an intense selloff, delivering bearish sentiments on the charts. This week, the token fell from the high of $3.25 and dragged over 60%, signifying a sharp decline despite the market’s bullish sentiments. The token split out the major support zone of $1.70 and made a fresh 52-week low in the previous sessions. The trend is bearish, and major short additions led the token into a significant correction. The token conveys fear among the investors, which leads to a panic selloff.
Huobi (HT) price slips cracked multiple support zones in a single go, and a death crossover was noted, which signifies further selloff may continue. The technicals showcased a massive bearish engulfing candlestick followed by a breakdown of the demand zone, which meant intense selling pressure. The mighty bears look aggressive and will punch the $1 mark soon. HT token price has slipped below the key moving averages and is below the 23.6% Fib retracement zone.
The Huobi token (HT) price was $1.12 at press time, with an intraday drop of 1.90%, showing bearishness on the charts. Moreover, the trading volume has increased by 97.78% to $28.13 Million. The pair of HT/BTC is at 0.0000182 BTC, and the market cap is $572.56 Million. Analysts are neutral and suggest that the HT token
price will continue to face a selloff and slip below $1 soon.
Huobi Displays a Breakdown: Will the Selloff Persist?
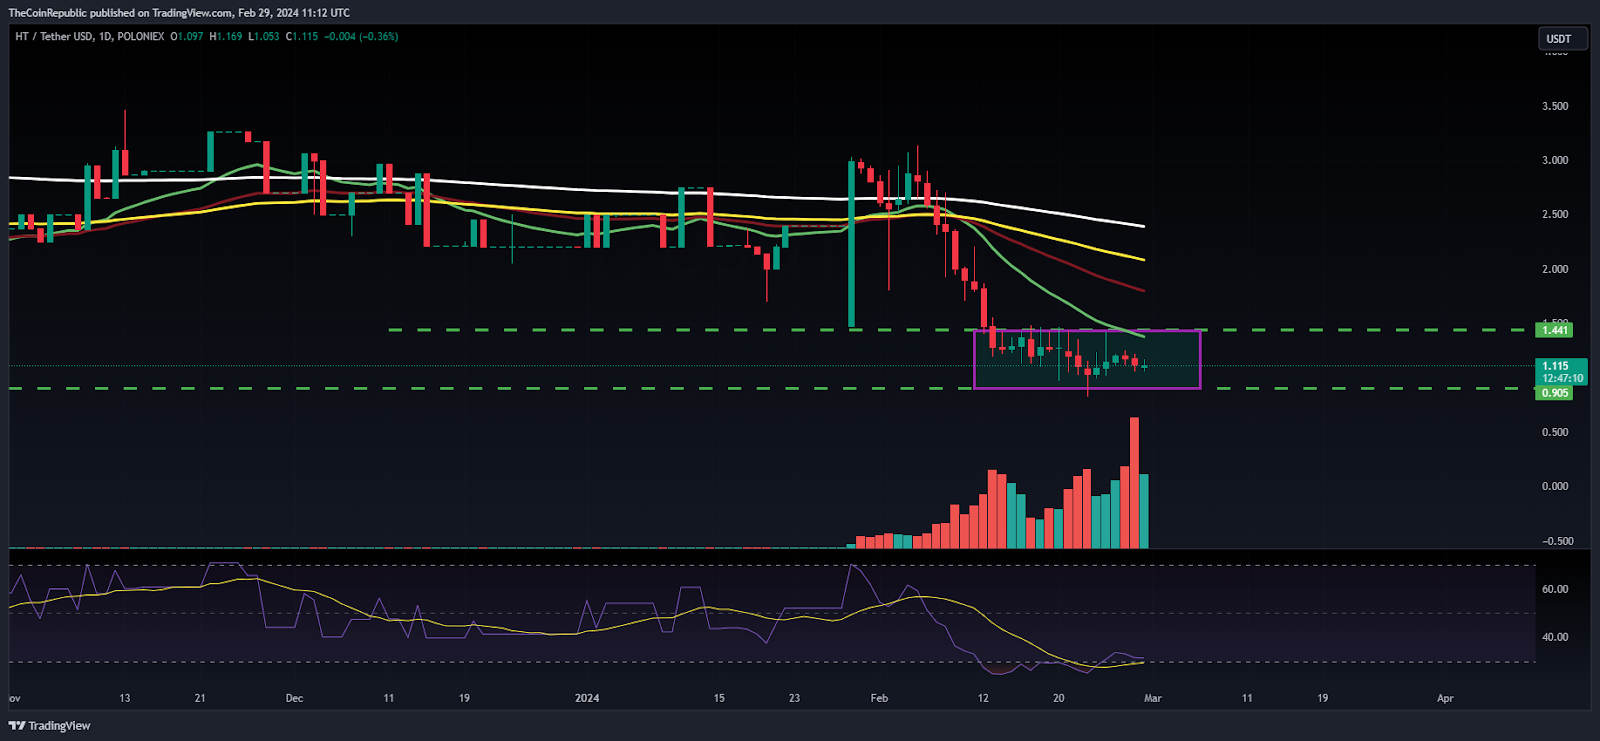
The Huobi price has persisted in dragging gains and has been in a severe downtrend for the past weeks. Additionally, the price action witnessed an intense breakdown with substantial volume, conveying the sellers’ intent to push the token below the $1 mark to unlock the downside of $0.500.
The Relative Strength Index (RSI) and Moving Average Convergence Divergence (MACD) indicators signify a bearish crossover and the sellers’ dominance. Furthermore, the indicators convey a bearish outlook, and the token may continue to slide gains for the following sessions.
HT Exhibits Bearish Dominance: Can Bulls Regain Strength?
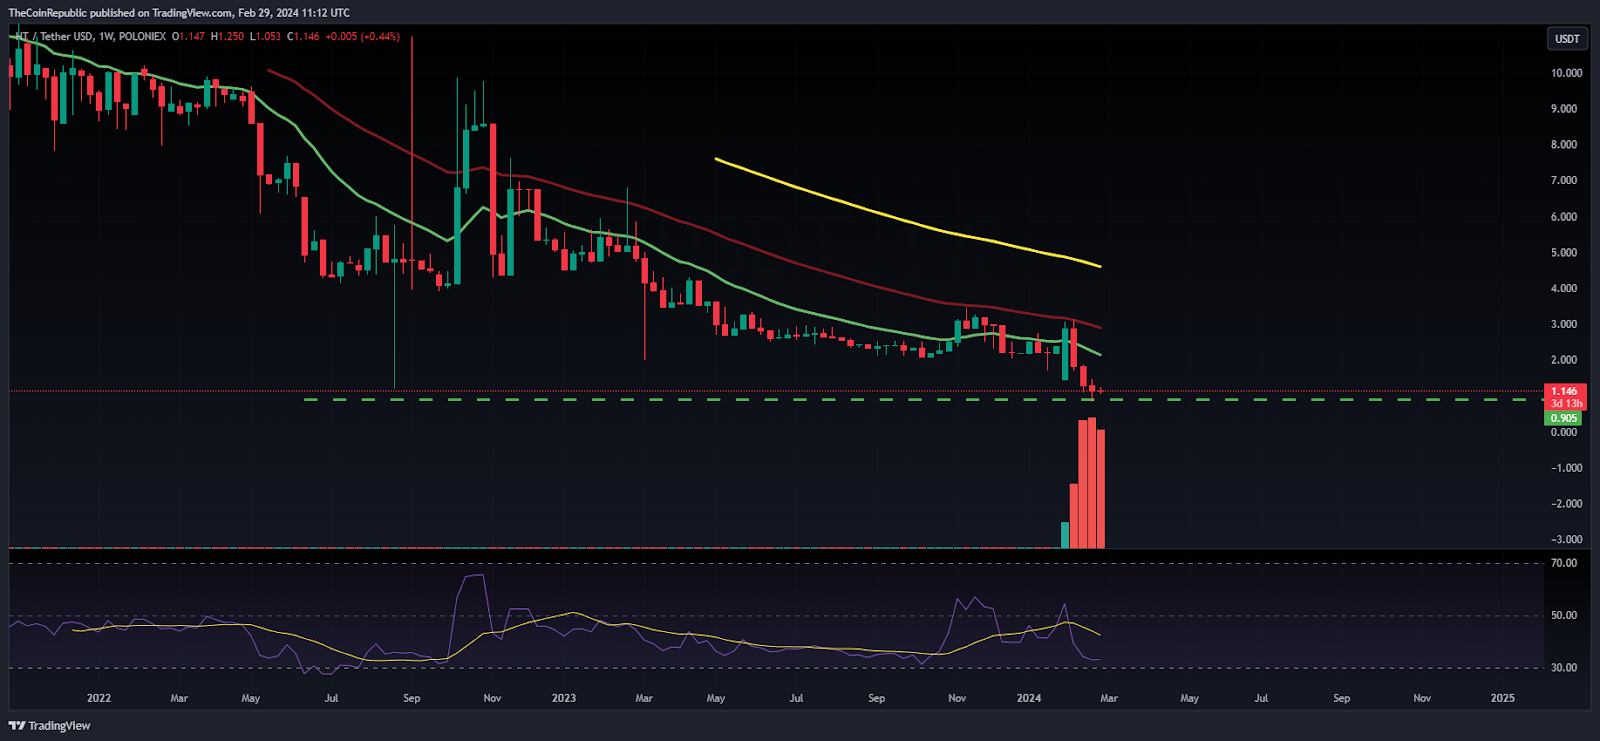
On the weekly charts, HT price has retested the demand zone of $1.20, but the bulls could not hold the region and made a fresh 52-week low mark of $0.8629 this week. The trend is negative; an intense correction was witnessed in the past sessions. However, bulls need to hold the gains and try to consolidate the token to prevent any further selloff.
Summary
The Huobi token (HT) price depicted follow-on selling momentum, and an intense selloff was witnessed in the past sessions. The token replicates the bearish sentiments and may slip below the round mark of $1 soon.
Technical Levels
Support Levels: $1.00 and $0.8800
Resistance Levels:$1.30 and $1.50
Disclaimer
The views and opinions stated by the author or any other person named in this article are for informational purposes only and do not constitute financial, investment, or other advice.

Amanda Shinoy is one of the few women in the space invested knee-deep in crypto. An advocate for increasing the presence of women in crypto, she is known for her accurate technical analysis and price prediction of cryptocurrencies. Readers are often waiting for her opinion about the next rally. She is a finance expert with an MBA in finance. Quitting a corporate job at a leading financial institution, she now engages herself full-time into financial education for the general public.
Source: https://www.thecoinrepublic.com/2024/02/29/huobi-is-differing-from-market-trend-will-ht-defend-the-1-mark/