Uniswap price analysis for December 12, 2022, reveals the market is following a complete bearish movement, obtaining massive negative momentum, and signifying a decline for the UNI market. The price of Uniswap has remained negative over the past few hours. Uniswap’s price analysis for today shows that the crypto is currently trading at $5.83 and has dropped by 3.23%. The price levels have moved down to meet the $5.79 level, which is acting as strong support for the market, while resistance is present at the $6.09 level. The 24-hour trading volume for UNI/USD pair is currently at $70,982,447 and a market cap of $4,440,152,860.
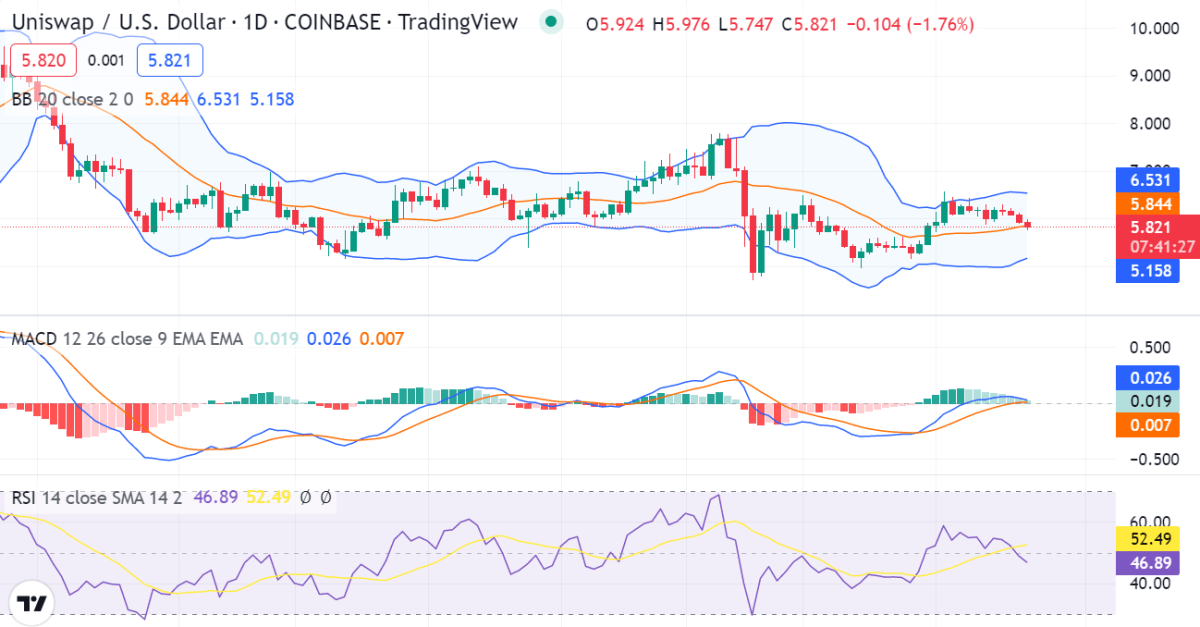
Uniswap price analysis on 1-day price chart: Bears maintain a downward trajectory as the price declines
The 1-day Uniswap price analysis is now in the bears’ favor once more as they have gathered momentum following a brief bullish run. The bears are inclined toward taking the price further below the current value to maintain their bearish slide that has been continuing for the past few hours. The price dropped to $5.83 after the bears took control of the market again.

The Relative Strength Index (RSI) indicator is currently at 52.49, which indicates that the market is neither overbought nor overbought. The MACD indicator is currently in the bearish zone as the signal line is above the candlesticks, indicating that the bears are in control of the market momentum. The Bollinger bands indicators also hold vital importance in informing us about the current market trends. Its upper band shows the value at $6.531, while its lower band shows $5.172, representing the resistance and support, respectively.
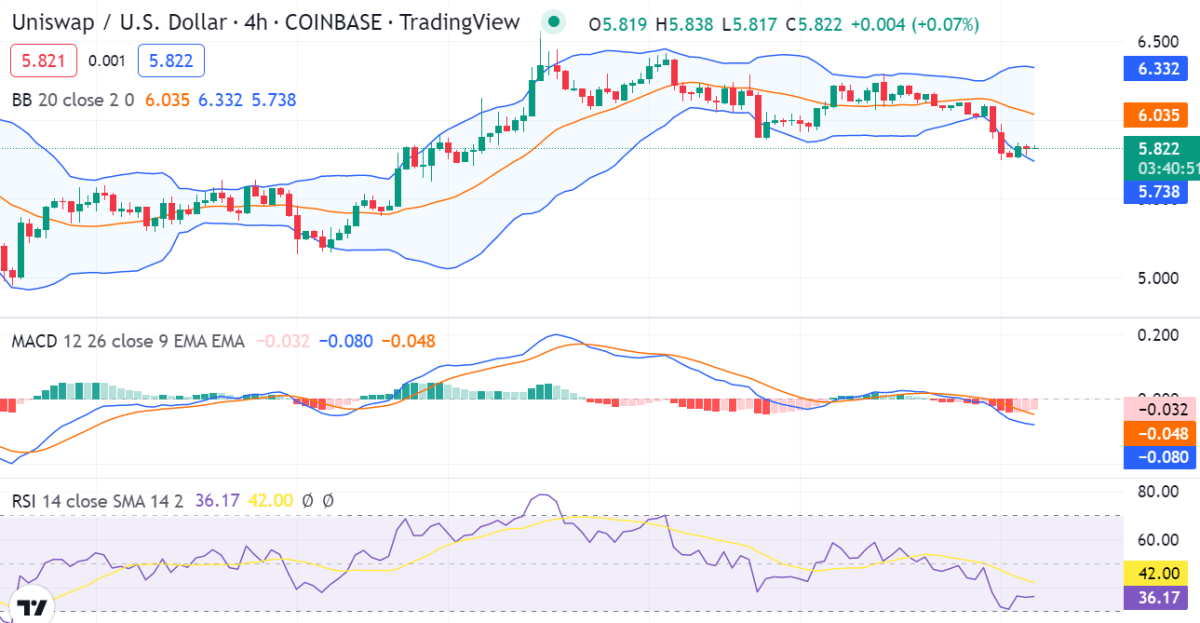
UNI/USD 4-hour price chart: UNI experiences $5.766 as the new support
The 4-hour Uniswap analysis confirms the downtrend, as the price has been trading below $5.83 for the last few hours. Following a downward swing, Uniswap price research demonstrates the market’s instability. This indicates that the price of Uniswap is continuing to decrease dynamically and is becoming less susceptible to a movement toward either extreme. The Bollinger bands values in the 4-hour price chart are as follows; the upper Bollinger band is at $6.332, whereas the lower Bollinger band is at $5.738, respectively.

The MACD indicator on the 4-hour timeframe is in a bearish zone, as the signal line is above the candlesticks, indicating a bearish market for UNI. The Relative Strength Index has also followed a sharp dip, as it has reached down near the undersold mark and is trading at an index value of 42.00
Uniswap price analysis conclusion
The one-day and four-hour Uniswap pricing analyses both show a decrease in price for today. Despite the market’s present bearish trend, there remains a chance that the bulls may regain control and drive prices higher. However, given that all market signs point to the possibility of further falling, this is unlikely to occur in the near future.
Source: https://www.cryptopolitan.com/uniswap-price-analysis-2022-12-12/
