Uniswap price analysis shows an uptrend market for UNI as the cryptocurrency surges to $5.46, buoyed by a strong recovery in the crypto markets overall. Bulls have recovered a good range from $5.09 to $5.50, providing ample support for the UNI price.
The support for UNI is present at $5.09, as evidenced by strong trading volumes that have pushed the price up from these levels in recent days. Furthermore, there is potential for further gains in the near future, as bullish momentum looks set to continue driving prices higher toward the $5.50 resistance level.
Uniswap price analysis 1-day price chart: UNI bulls gain 7.33 percent
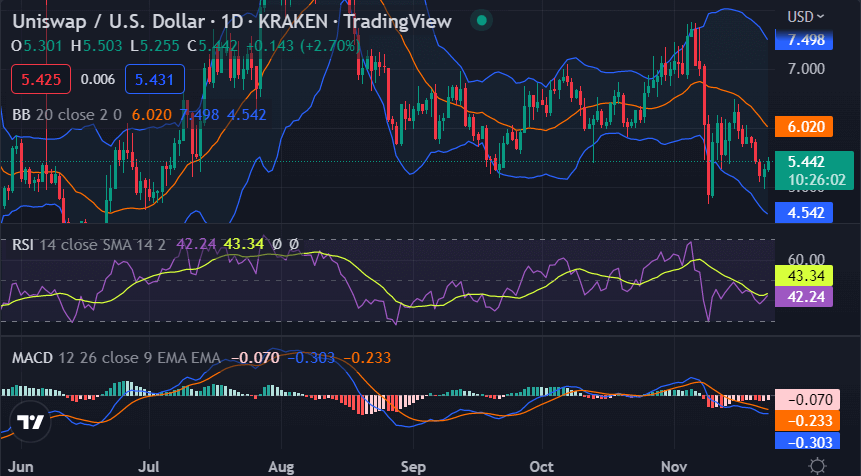
The 1-day price chart for Uniswap price analysis shows that the present bullish momentum has yielded good results as UNI is now trading at $5.46. The cryptocurrency has gained 7.33 percent over the past 24 hours, which is a promising sign for traders and investors looking to capitalize on the crypto market’s recovery.

The Volatility is increasing again as Uniswap has been showing a volatile character for the past few days. The Bollinger bands started expanding, indicating a possible breakout in either direction. The Relative Strength Index (RSI) is currently at 43.34, showing that the market is neither overbought nor oversold. This suggests that there is still room for growth. The MACD oscillator indicator shows strong bullish signs, as well as the histogram moving upwards.
UNI/USD 4-hour price chart: Bulls take the price further high
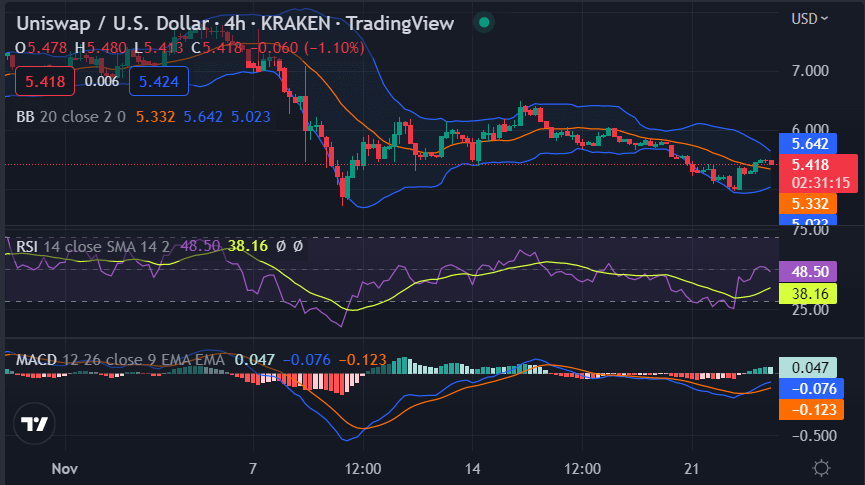
The 4-hour Uniswap price analysis shows that the price has been rising from the very start of today’s session, as the bears were in lead yesterday. The bulls have taken control of the market and have pushed the price to $5.47, which is a good sign considering that it was trading at $5.14 yesterday morning.

The Volatility is increasing again as Uniswap has been showing a volatile character for the past few days. The Bollinger bands started expanding, indicating a possible breakout in either direction. The Relative Strength Index (RSI) is currently at 38.16, showing that the market is neither overbought nor oversold. This suggests that there is still room for growth. The MACD oscillator indicator shows strong bullish signs, as well as the histogram moving upwards.
Uniswap price analysis conclusion
Uniswap price analysis suggests the crypto pair is overall bullish, and the price is on an upwards trend. Both daily and hourly technical indicators also suggest, the momentum is towards the upside, and if bulls gather enough support, they can still push through toward the $5.50 level.
Disclaimer. The information provided is not trading advice. Cryptopolitan.com holds no liability for any investments made based on the information provided on this page. We strongly recommend independent research and/or consultation with a qualified professional before making any investment decisions.
Source: https://www.cryptopolitan.com/uniswap-price-analysis-2022-11-23/
