Recent Uniswap price analysis shows a bearish swing in the market resulting in UNI correcting down to $6.64. A decrease in price levels has been observed in the last 24 hours as well, which is quite discouraging for the buyers. The price has been corrected down below the 6.00 level, as the bearish momentum has returned after bullish activity. Although the price has experienced a downfall recently, but earlier this week, the coin gained sufficient value.
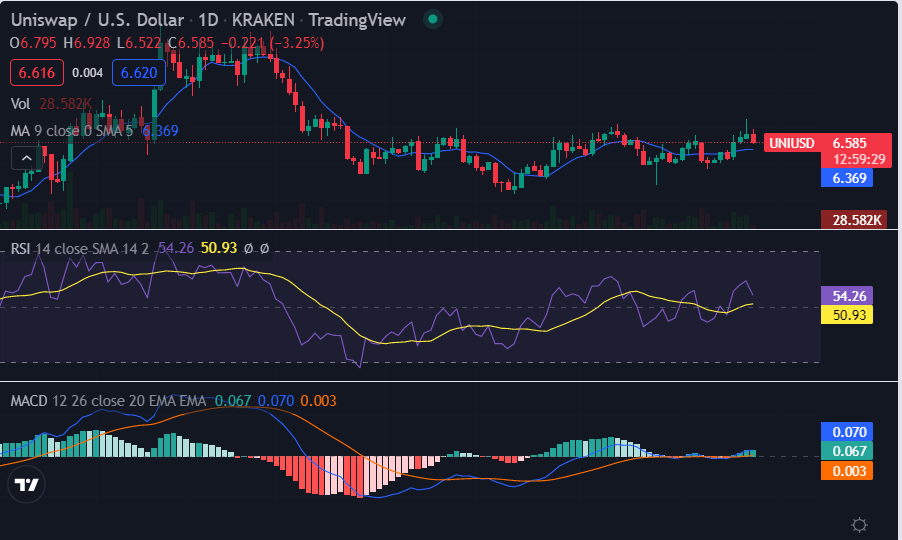
UNI/USD 1-day price chart: Bearish wave extends as price steps to $6.64 low
The 1-day Uniswap price analysis is showings signs of a bearish trend as well, as the price has dropped down to a significant level. The UNI/USD is down by 5.68% in the last 24 hours, and it has been trading close to support at $6.54. The current market capitalization of Uniswap is at $5,029,329,034 with a 24-hour trading volume at $5,029,329,034.

Looking at the technical indicators, the MACD line is below the signal line to indicate bearish market momentum. The price has gone below the moving average value, i.e., $6.36, as a result of the bearish trend. The RSI indicator is also approaching the oversold region at 50.93 to show that selling pressure is increasing in the market.
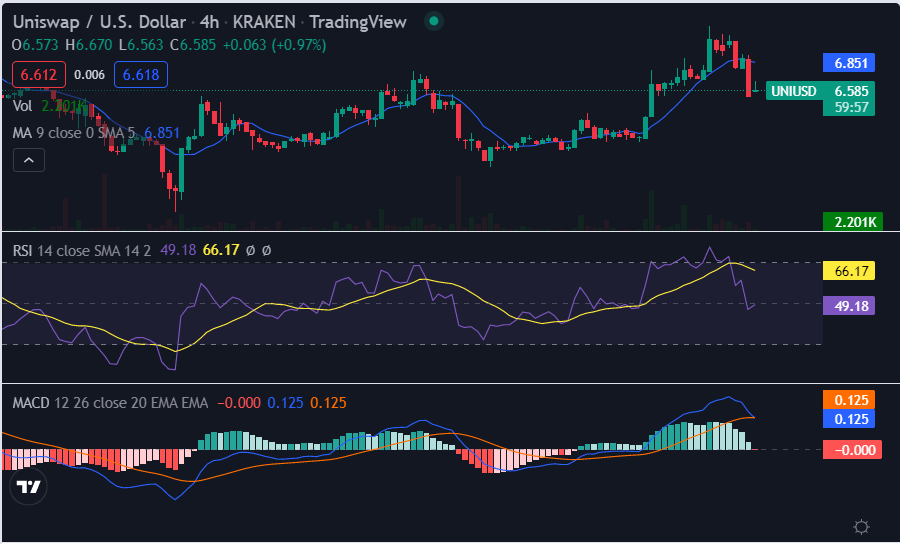
UNI/USD 4-hour price chart: Bearish pressure takes the price beyond $6.64 fence
The hourly Uniswap price analysis dictates that a decrease in price has taken place in the last 4 hours. The circumstances have been going favorable for the bulls for the past few days, as the price had made a jump above the $7.00 level. However, it couldn’t maintain its bullish momentum and has faced bearish pressure, resulting in UNI/USD trading at $6.64 currently.

The moving average (MA) value in the one-day price chart is at the $6.85 level. Whereas the MACD line has crossed below the signal line to indicate that bearish market pressure is increasing. Additionally, The Relative Strength Index (RSI) index has slightly increased up to an index of 66.17, but the downward curve is not steep.
Uniswap price analysis conclusion
To conclude the Unswap price analysis shows that a bearish trend has been dominating the market, causing a decline in price levels. However, if the bearish momentum continues, UNI/USD may test the next support level at $6.00.and, if there is a bullish correction in the market, UNI/USD could reach resistance levels at $7.12 and $7.50.
Disclaimer. The information provided is not trading advice. Cryptopolitan.com holds no liability for any investments made based on the information provided on this page. We strongly recommend independent research and/or consultation with a qualified professional before making any investment decisions.
Source: https://www.cryptopolitan.com/uniswap-price-analysis-2022-10-28/
