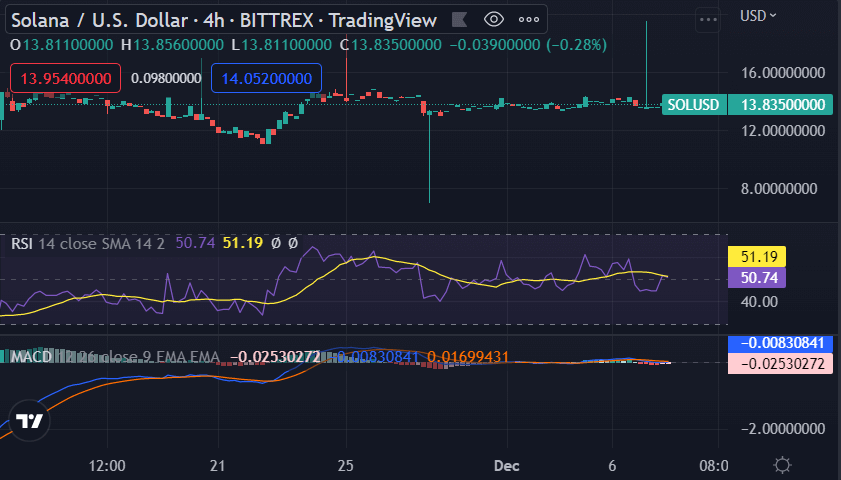
Solana price analysis has been on an upward trajectory in recent days, breaking through the $13.42 barrier with bullish support. The uptrend has been getting stronger for the past few days, and today the price managed to escape the resistance present at $13.98. The price is expected that it will soon move on to further higher levels in the upcoming week. Further recovery is possible only if the support remains strong at $13.87. Over the last 24 hours, the cryptocurrency market has been in good shape. Bitcoin is up 2.35%, while Ethereum is up 4.03%.
SOL/USD 1-day price chart: Price hits $13.87 high as bullish trend aggravates
The daily Solana price analysis is confirming an upward trend for the day as an increase in price has been reported. The price has constantly been turning to higher points in the past few weeks, as the bulls have been trending. Today, a significant rise in price was observed as the price moved on to $13.87 in height.

The 24-hour chart shows that the SOL/USD pair is trading above all key moving averages, which adds to the bullish picture in the market. Similarly, the moving average convergence divergence (MACD) curve represents a healthy outlook for SOL, as it moved past its neutral zone over the past 24 hours. The RSI indicator is also showing a strong bullish trend, as the value currently stands at 37.20. All in all, it seems that the price will continue to move higher and reach new heights during the coming weeks.
Solana price analysis: Latest developments and further technical indications
The 4-hour Solana price analysis shows the crypto pair price is following an uptrend on the four hours price chart as the price has undergone a considerable amount of increase over the past few days. Most of the price increase has come from the bulls’ efforts, with the price continually moving higher and higher. The most recent price peak was found at $13.87, and this is what makes it clear that the market sentiment is bullish.

The RSI indicator is currently at around 51.19, which indicates a strong bullish movement on the horizon. The MACD momentum indicator has also turned to positive values and is showing an upward trend in price movements. The Moving average on a 4-hours chart is also indicating a strong uptrend as the latest price value has crossed over it.
Solana price analysis conclusion
The Solana price analysis is bullish today as the coin, after breaking downwards, managed to rally higher and is trading in greens at the moment. We expect SOL/USD to continue upside after retracing for a few hours more, If the trend continues, the next resistance above is 13.98, and if that breaks we may expect the price to move further higher to $14.00 resistance levels soon.
Disclaimer. The information provided is not trading advice. Cryptopolitan.com holds no liability for any investments made based on the information provided on this page. We strongly recommend independent research and/or consultation with a qualified professional before making any investment decisions.
Source: https://www.cryptopolitan.com/solana-price-analysis-2022-12-09/
