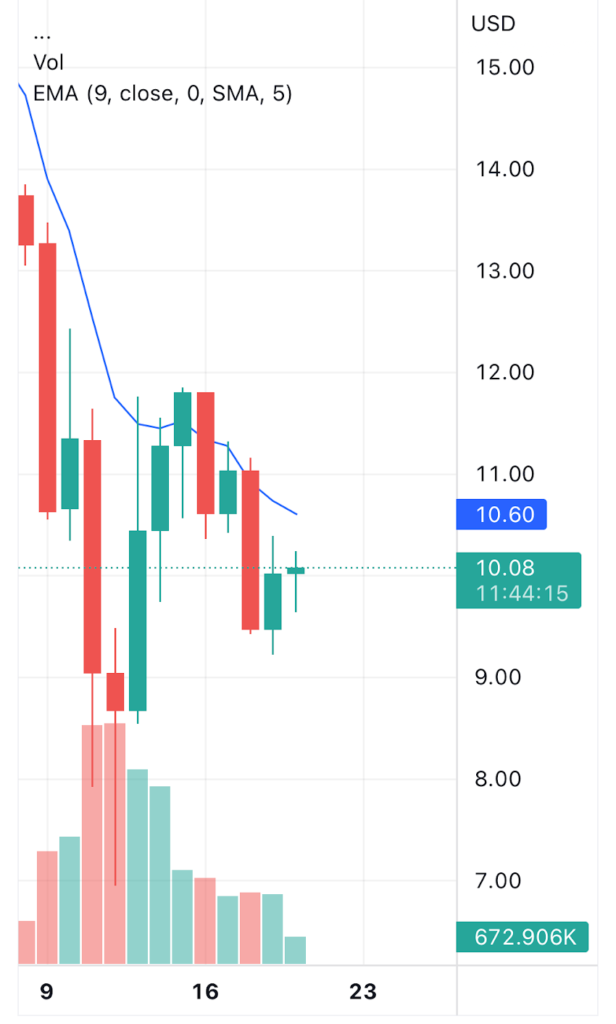
- The crypto asset is trading below the moving average
- The DOT/BTC pair has a value of 0.0003322 BTC with a gain of 0.97 percent in it.
- Technical indicators suggest a bullish turnover.
Polkadot is an open-source sharded multichain protocol that connects and secures a network of specialized blockchains, facilitating cross-chain transfer of any data or asset types, not just tokens, thereby allowing blockchains to be interoperable with each other.Polkadot is a sharded multichain network, meaning it can process many transactions on several chains in parallel
The DOT analysis over the daily time frame gives us an idea of downtrend but flickering, which means both the bulls and bears are fighting to take over the market. The price made a lower low of 9.58 over the past 24 hrs session.
Price for one DOT coin is at 10.06 USD with a gain of 4.41% in its market capitalization over the 24 hrs trading session. DOT has a trading volume of 785 million which is currently at a decrease of 10.19% which means DOT seriously needs to attract buyers in order to surge upwards and a market cap of 9.9 billion with a gain of 4.74% in it. The volume market cap ratio for DOT has a value of 0.07891.
The DOT/BTC pair has a value of 0.0003322 with a gain of 0.97 percent in it.

What do technical indicators suggest about DOT?
DOT is currently making a sideways trend over the short term (4 hrs) graph, which means the coin has managed to attract bulls to buy the dip and help the coin get back into the market. The coin must have to go green to sustain in the market.
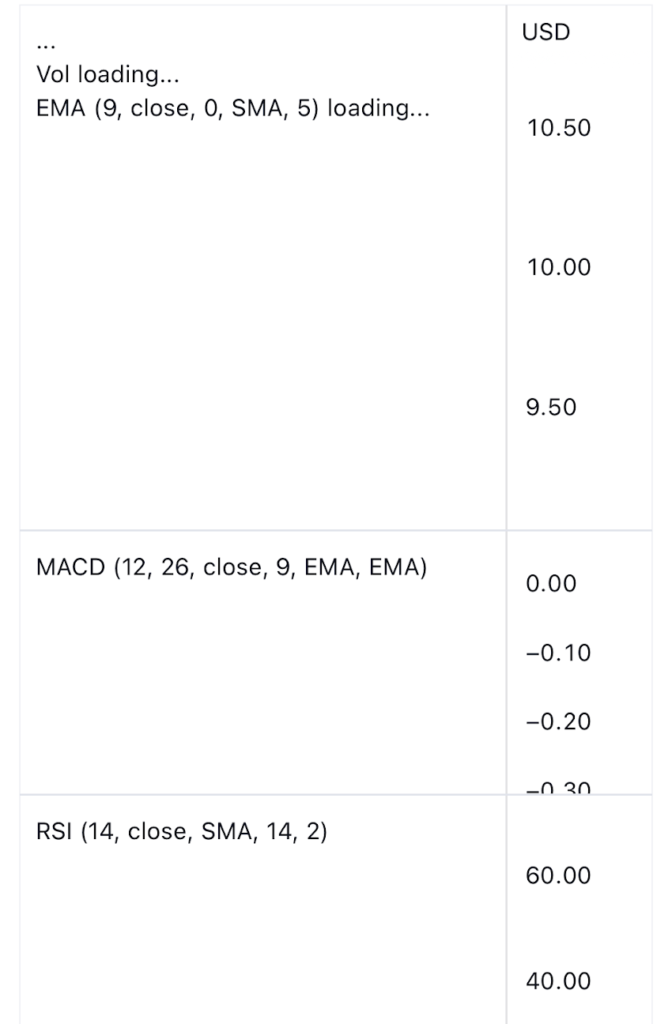
MACD exhibits that the coin is now starting a bullish turnover as the MACD line just made a positive cross over the MACD signal line and the histograms are turned green and rising now!
While the relative strength index shows that it is not oversold or overbought yet, and the value for RSI is below 50 and the investors may expect any directional change .

Conclusion
A downtrend over the daily graph can be observed but the hourly graph shows that this maybe the initiation of the trend reversal as the technical indicators are supporting the bullish movement.
Disclaimer
The views and opinions stated by the author, or any people named in this article, are for informational ideas only, and they do not establish the financial, investment, or other advice. Investing in or trading crypto assets comes with a risk of financial loss.
Source: https://www.thecoinrepublic.com/2022/05/20/polkadot-price-analysis-is-dot-in-a-recovery-phase-what-bulls-are-planning/
