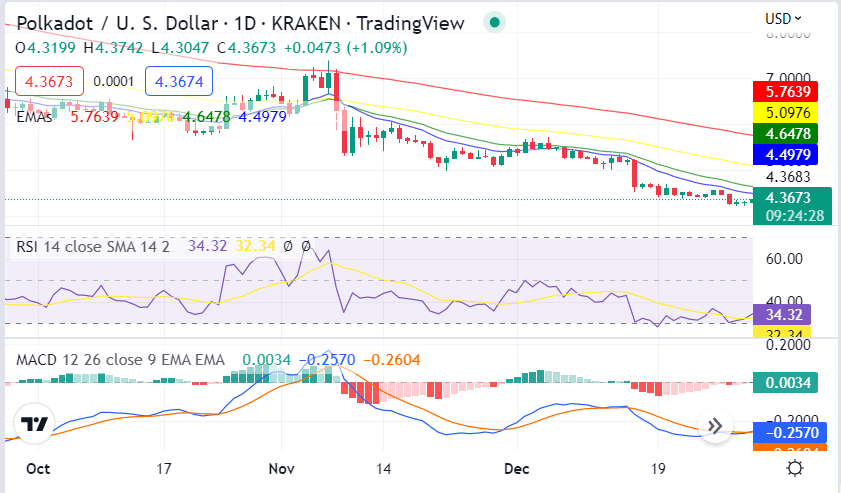
Polkadot price analysis reveals the market is positive in the last 24 hours. The prices opened the daily trading session in intraday at $4.32 and hit the highest at $4.36 after a surge of 2.11 percent.

The market is currently facing stiff resistance at $4.36, which was previously support turned resistance. The prices are expected to retrace from the current levels and find support near $4.26 before resuming the uptrend. The bull run is expected to continue in the near term as the technical indicators are giving positive signs. The general market condition is positive as top coins like Bitcoin and Ethereum are also in the green, with also altcoins gaining traction.
Polkadot price analysis 1-day price action: Bulls in control
The 24-hour price action of Polkadot shows a bullish trend. The buyers have been able to break past the stiff resistance at $4.36 and establish long positions in the market. The prices have been able to close the day in green by gaining significantly, which is a positive sign for the bulls.

The MACD indicator is also in the positive area and the histogram has formed a green bar, which indicates that buyers are in control of the market. The relative strength index (RSI) is also in the overbought zone, which suggests a possible pullback in the prices. The EMA lines are also providing support to the buyers, with both lines trending in the upward direction.
DOT/USD price analysis on a 4-hour price chart: Latest support lies at $4.26
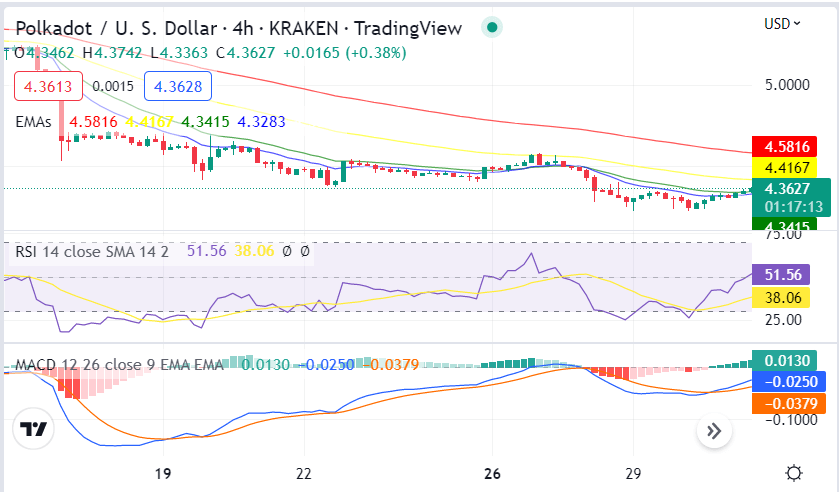
The 4-hour Polkadot price analysis is also going in the bullish direction as well, as the price has been flashing up consistently. This happened after the bulls got a jumpstart at the start of the day, and since then, their momentum has shown its strength. The price has been increased to $4.35, which is quite high compared to yesterday’s price levels.

The 20-day EMA ($4.26) is providing strong support to the bulls, and any possible pullback in the price should find strong buying pressure near that level. The MACD indicator is above the zero line and the signal line is also in the positive territory. The RSI is going 38.06 for the 4-hour price chart, which is quite high and shows the coin as overvalued at the moment, and the curve of the indicator is still upwards.
Polkadot price analysis conclusion
The price has increased as the bulls have scored high, according to the latest Polkadot price analysis. The DOT/USD value is $4.35 at the time of writing and is expected to increase in value furthermore in the upcoming hours as well. However, the coin may correct in the next trading session as bulls might feel the exhaustion from the current rally.
Source: https://www.cryptopolitan.com/polkadot-price-analysis-2022-12-31/
