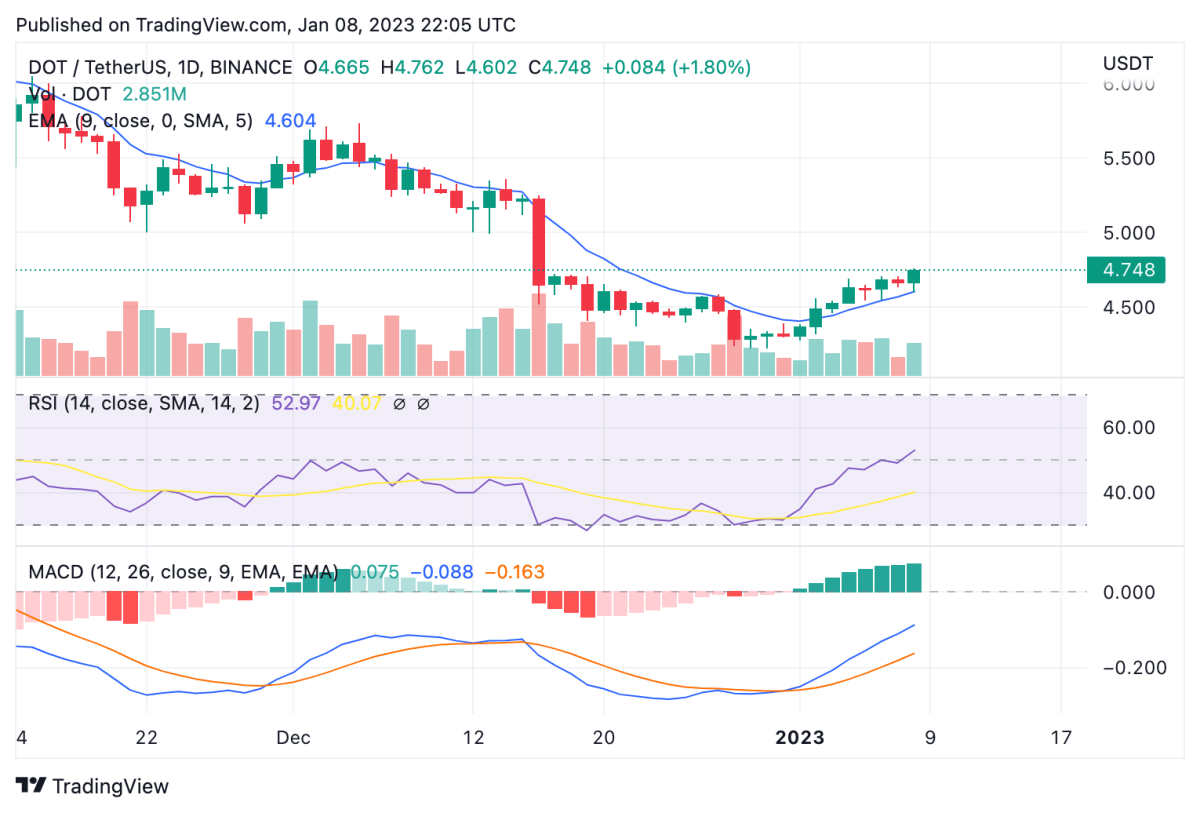
Polkadot price analysis shows a bullish run in place, as price rose around 2 percent over the past 24 hours to move up to $4.75. DOT price has risen more than 10 percent this past week, starting from a month-long low of $4.306 on January 2 to move up to today’s high of $4.76. Polkadot price now sits on the cusp of the next resistance point at $5. A bigger uptrend could follow if this hurdle is cleared, however, the current rally may be short lived and DOT may experience another downtrend if unable to break past the resistance point.
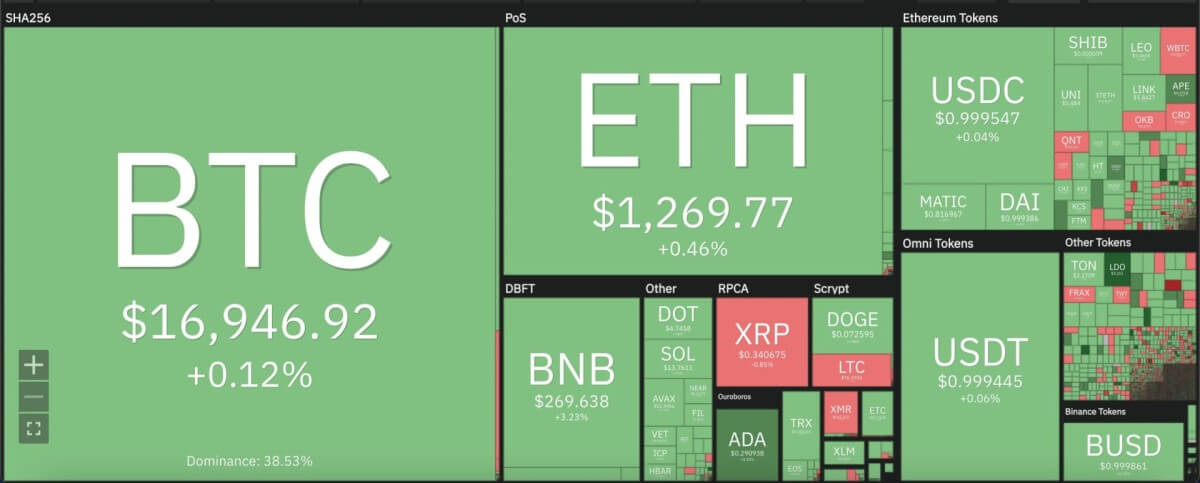
The larger cryptocurrency market made minor increments over yesterday’s price over the past 24 hours, as Bitcoin moved into touching distance of the $17,000 mark, and Ethereum moved closer to $1,300. Among leading Altcoins, Ripple stayed at $0.34, while Dogecoin also remained at $0.07. Cardano rose 5 percent to move up to $0.29, whereas Solana also rose 5 percent to go up to $13.76.

Polkadot price analysis: 24-hour RSI moved up but remains in oversold region
On the 24-hour candlestick chart for Polkadot price analysis, price can be seen forming an ascending triangle pattern since January 2, with price rising more than 10 percent to reach the current level. The recent uptrend has lifted the 24-hour relative strength index (RSI), but it remains in the under-valued region. This can be taken as a sign of concern, as the RSI will need to move above the 45 mark to maintain the bullish sentiment. If the RSI remains at low to mid level, some traders may start selling on a large scale and trigger a bearish trend for DOT.

Over the past week, price can be seen moving above the 9 and 21-day moving averages, along with the crucial 50-day exponential moving average (EMA) at $4.60. Meanwhile, the moving average convergence divergence (MACD) curve also shows a bullish divergence in place on the short-term to complement the recent price trend.
Disclaimer. The information provided is not trading advice. Cryptopolitan.com holds no liability for any investments made based on the information provided on this page. We strongly recommend independent research and/or consultation with a qualified professional before making any investment decisions.
Source: https://www.cryptopolitan.com/polkadot-price-analysis-2023-08-01/
