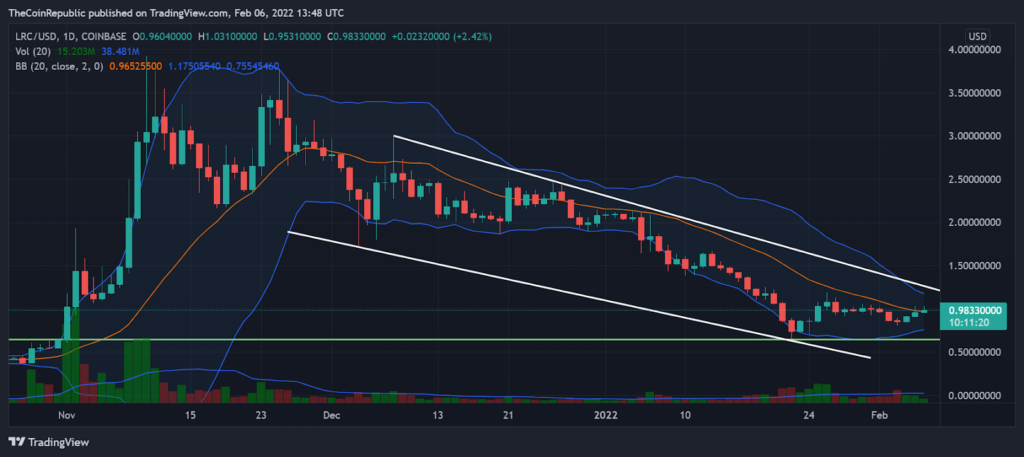
- LRC Token Price has been on a bearish parallel channel for the last couple of months
- The Bollinger bands have been narrowing after a long time of separation
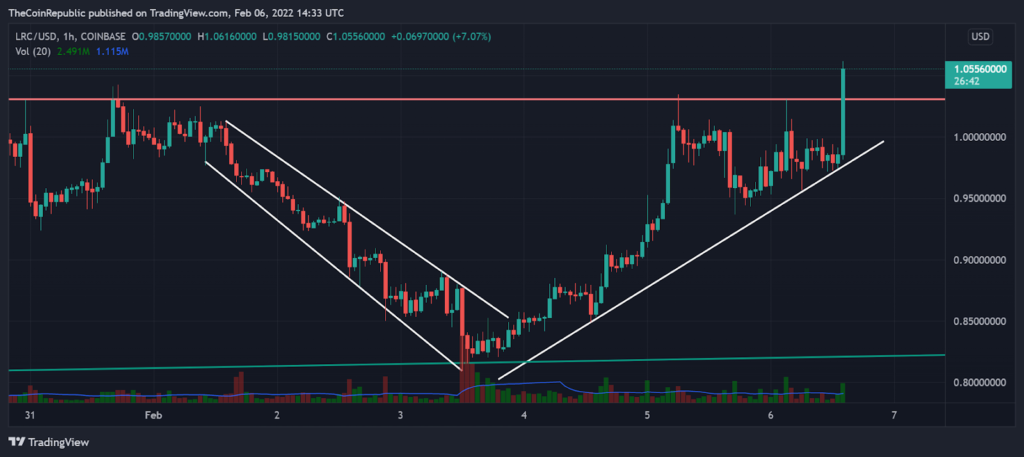
- The coin is showing strong bullish momentum on the hourly chart

LRC Token Price has been on a bearish channel over the last few months on the daily chart. The coin has been consolidating after taking support at $ 0.65. The Bollinger bands have narrowed now indicating a consolidation phase for the token. The volumes have been increasing steadily for the token.

LRC Token Price has been in a bullish zone over the last few days and has broken out of a resistance zone at $ 1.00. The coin was in a bearish zone as seen on the chart in the last week and after taking support at $ 0.80 the coin moved on a bullish momentum. The coin has seen heavy volumes coming in over the last few days.
– Advertisement –
Also Read : Venezuela to put 20% tax on transactions in cryptocurrency
Conclusion:
The coin is on a bullish momentum on the hourly chart and has broken a short-term resistance zone. The coin is in a consolidation phase after a two-month-long bearish dominance.
Support: $ 0.65
Resistance: $ 1.20
DISCLAIMER: The views and opinions stated by the author, or any people named in this article, are for informational ideas only, and they do not establish any financial, investment, or other advice. Investing in or trading crypto assets comes with a risk of financial loss.
Source: https://www.thecoinrepublic.com/2022/02/07/lrc-price-analysis-bollinger-bands-narrowing-on-the-lrc-chart-indicating-a-consolidation/
