Litecoin price analysis is on a bullish trend today, with the LTC/USD pair rising to the $70.14 mark. The bulls have been in control of the market and have pushed prices higher, which have increased by 1.29%. However, the digital asset is encountering resistance and may retreat to test support at $68.75. The price movement recently produced a bullish engulfing candlestick pattern, which shows that the bears are losing ground. The resistance for the LTC/USD pair is at $70.84, and a break above this level could lead to Litecoin aiming for the next resistance level at $71. The market cap for the coin stands at $5,903,307,643, and the 24-hour trading volume is at $441,054,675.
LTC/USD 1-day price chart: Bullish strive to breach the $70.84 resistance level
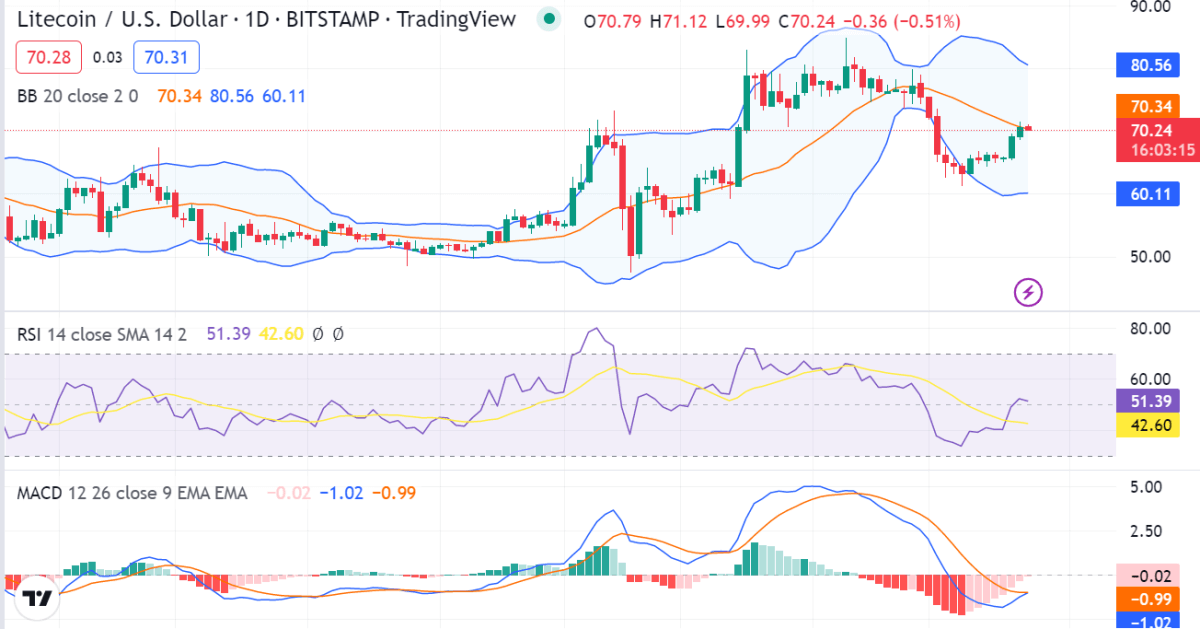
The 1-day Litecoin price analysis reveals that the bulls are dominating the market today, and the pair has surged by over 1.29 percent and is currently trading at $70.14. Because market volatility follows a slightly closing movement, the cryptocurrency is less vulnerable to volatile change on either extreme. The upper limit of Bollinger’s band is present at $80.56, which serves as a resistance point for LTC. Conversely, the lower limit of Bollinger’s band is currently at $60.11, which serves as another support point for LTC.

The moving average convergence and divergence (MACD) line is above the signal line, indicating that the bulls have the momentum to push the prices higher. The relative strength index (RSI) is currently at 42.60, which shows a slight increase. The RSI indicator is presently rising, suggesting that the bulls are still in market control.
Litecoin price analysis on 4-hour chart: Recent updates
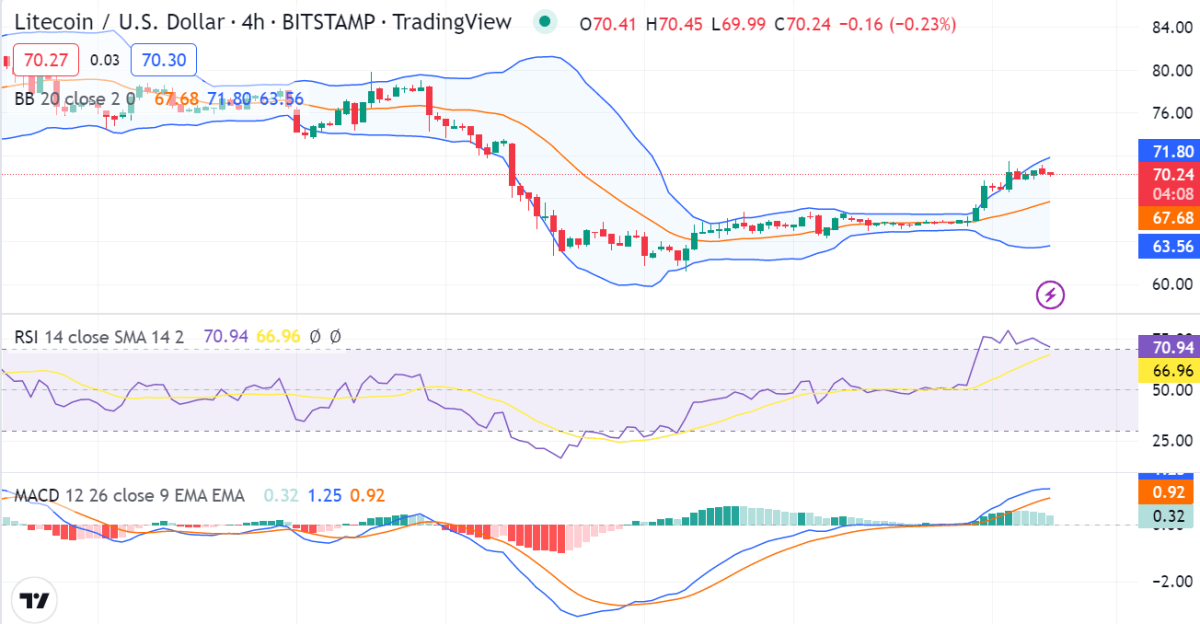
The 4-hour price chart for Litecoin shows an expanding trend because the price has been moving upward for the last 24 hours. The four-hour price chart, which shows green candlesticks signaling an increase in coin value, confirms this. According to the positive momentum, the price has effectively recovered over the $70.14 margin, and it appears that the bulls will hit their next objective soon.

The moving average convergence The divergence indicator shows a change in momentum to the bull’s side as the signal line (red) is now above the MACD line (blue). However, the price is trading within the above histogram. The relative strength index (RSI) score is trading above the 60 level, which indicates that the bulls are in control of the market. Moreover, In the past few hours, the market trend has moved into the bullish zone. The trend will probably have more room to move toward either extreme because the market volatility seems to be moving in an upward direction. The bullish period appears to be here to stay.
Litecoin price analysis conclusion
In conclusion, Litecoin’s price analysis shows a slightly bullish trend in the market. The digital asset is currently trading at a critical junction, and a breakout from either side of the range could set the tone for the next move. The market shows constantly increasing characteristics, which means the bullish movement will continue in the near future.
Source: https://www.cryptopolitan.com/litecoin-price-analysis-2022-12-27/
