Litecoin price analysis shows that the LTC/USD pair is currently in an extreme bearish trend. The next support level for the pair is present at $52.26, which if broken can push the price further down to the $52.00 support level. On the other hand, resistance for the pair is present at $53.35. A break above this level can take the price back to the $53.80 resistance level.
The LTC/USD has decreased by 1.55% in the last 24 hours and is currently trading at $52.51. The digital asset has a market capitalization of $3.71 billion and is ranked at number 20 on CoinMarketCap while the 24-hour trading volume for the digital asset is $354 million.
LTC/USD 4-hour price analysis: Latest developments and technical analysis
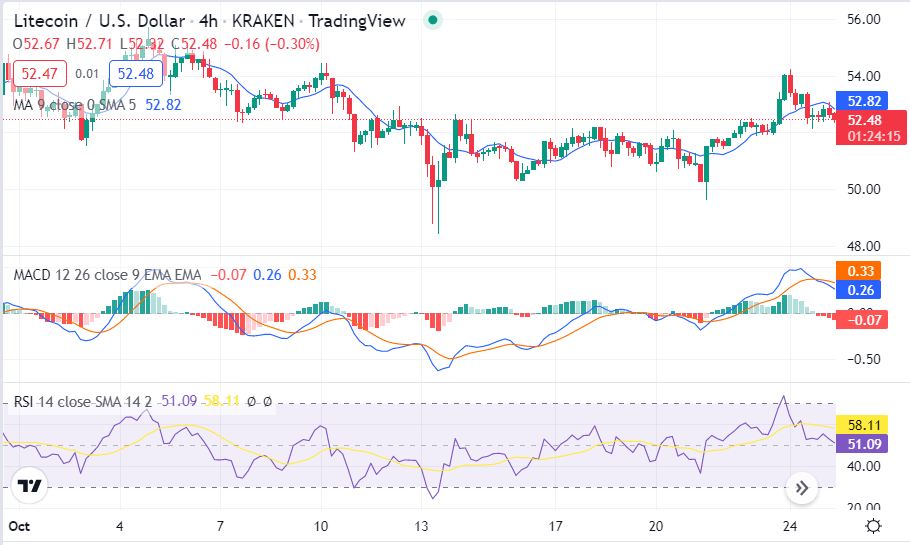
The Litecoin price analysis on a 4-hour chart shows LTC has been following a descending triangle pattern. The descending triangle is a bearish continuation pattern that is formed when the price action of an asset creates lower highs and finds support around a horizontal level. A breakdown from this pattern would see LTC head towards the $53.35 level.

The Relative Strength Index (RSI) is currently at the 58.11 level and is slowly heading towards the oversold region, which is a further indication that the bears are in control of LTC price action. The MACD line (blue) is currently trading below the signal line (red), which is a bearish sign. The moving averages are also indicating a bearish trend as the 50-day MA is trading below the 200-day MA.
Litecoin price analysis on a daily chart: Bears adamant in pushing LTC below $53.35
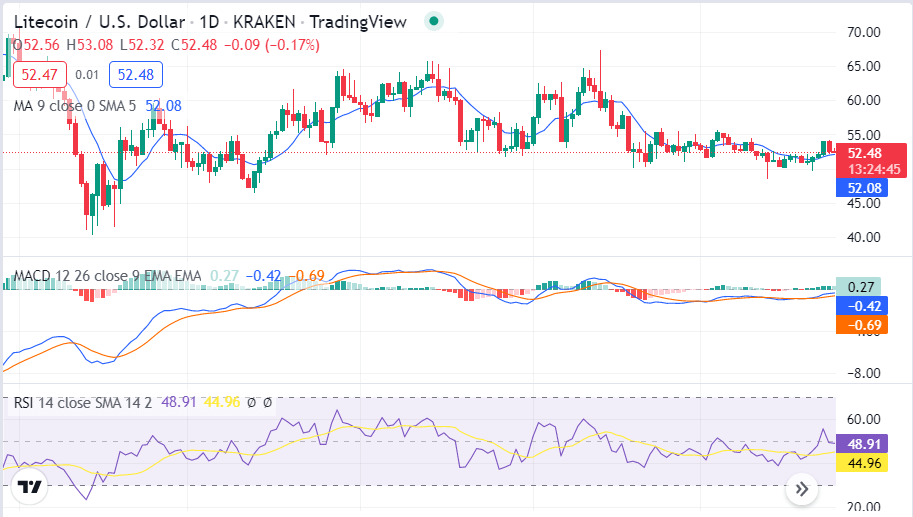
Litecoin price analysis on the daily chart shows the prices have been hovering around a range of $52.26 to $53.35, with both the moving averages and the Relative Strength Index (RSI) around the midpoint.

The bearish trend is further evident on the daily chart as the 50-day MA is well below the 200-day MA. The 200-day MA is currently serving as a strong resistance level for Litecoin, with the price failing to break above it on multiple occasions over the past few weeks.
Litecoin price analysis conclusion
Litecoin price analysis reveals that the cryptocurrency is currently in a bearish market the coin price covering ranges downwards and is trading at the $52.51 mark. Chances are there for further decrease as the price has decreased during the last hours. We expect the LTC/USD to float above the $52.26 support level and may rebound to $53.35 in the near term. The technical indicators are currently bearish, and a breakout or a rebound is awaited before making any investment decisions.
Disclaimer. The information provided is not trading advice. Cryptopolitan.com holds no liability for any investments made based on the information provided on this page. We strongly recommend independent research and/or consultation with a qualified professional before making any investment decisions.
Source: https://www.cryptopolitan.com/litecoin-price-analysis-2022-10-25/
