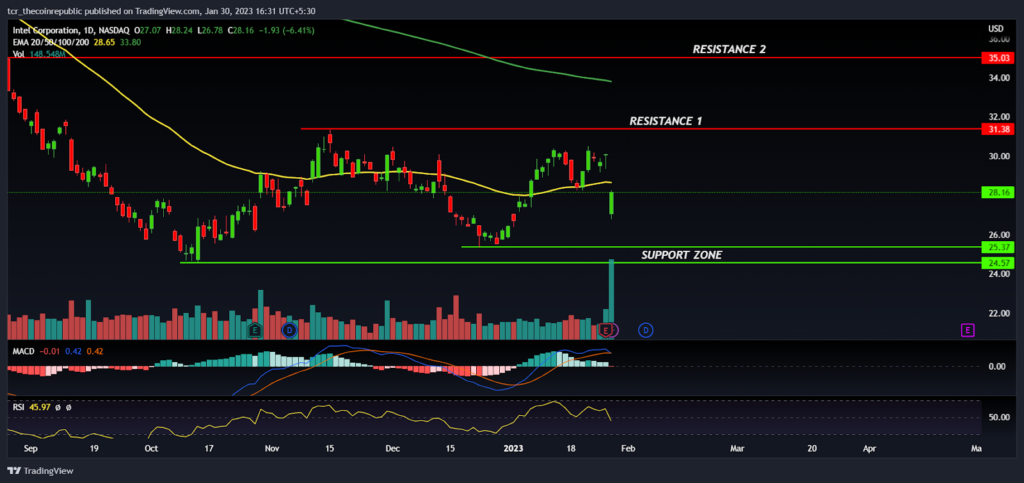
- Intel stock price slipped below the 50 day EMA after the release of Q4 earnings
- Intel Corporation missed the EPS estimates by the 4.5%
- NASDAQ : INTC is down by 3.63% on the weekly basis
Intel Corporation Inc stock price is trading bearish cues and bear’s are trying to keep the prices below the 50 day EMA to show its dominance on the higher levels. However, the downside seems to be limited till the support zone is sustained. Currently, NASDAQ : INTC stock price is closed at $28.16 with the intraday loss of 6.41% and market cap stood at $116.498B
Intel stock provides a buying opportunity for the investors ?

On a daily time frame, Intel corporation stock price is in a downtrend and struggled to hold the prices above the 50 day EMA.
In the beginning of the January, Intel stock price took support near the demand zone at $25.00 and gained some positive momentum which helps the prices to reclaim the 50 day EMA (yellow) but unfortunately it faced resistance near to $30.00 level and due to poor performance in the current quarter prices again drops below the EMA.
Intel stock price gaps down on the Friday session but surprising bulls had shown a sharp recovery and volume also surged to the highest level which indicates that some genuine buyers had taken long positions and have grabbed this opportunity to accumulate the stock at lower levels. However, In the short period of time, Intel stock may trade with a negative bias and the 50 day EMA (yellow) may act as an immediate hurdle for the bulls followed by next hurdle will at $31.38
Intel Corporation Inc has missed the EPS estimates but despite of that prices had bounce back with a positive momentum which shows the confidence of the investors but if prices broke down the friday’s low at $26.78 then it will trigger a mild negative sentiment and bear’s can drag the prices down towards the $25.00 level. The MACD curve is reversing down and on the way to generate a negative crossover whereas the RSI at 45 sloping south denotes it may test the oversold zone.
Financials of the Intel corporation Inc are declining if we compare it with FY 2021 Revenue at $63.1B down by 20% on a yearly basis, Net Income at $8.01B down by 60%, Profit margin at 13% down by 25% and EPS stood at $1.95 down form $4.90 in FY 2021. Therefore, it will be a matter of concern if Intel continues the same trend in FY2023.
Summary
After analyzing the Intel stock, it seems like prices are likely to trade in the wide range between $24.00 to $31.00 until some fundamental improvement is visible in the company financials. However, if overall market sentiment turned bullish then we may see some positive surprises in the intel stock.
Technical levels
Resistance levels : $31.00 and $35.00
Support levels : $25.00 and $24.00
Disclaimer
The views and opinions stated by the author, or any people named in this article, are for informational ideas only, and they do not establish financial, investment, or other advice. Investing in or trading crypto assets comes with a risk of financial loss.
Source: https://www.thecoinrepublic.com/2023/01/30/intel-corporation-intc-stock-price-analysis-intc-stock-tumble-after-the-q4-earnings-more-downside-possible/
