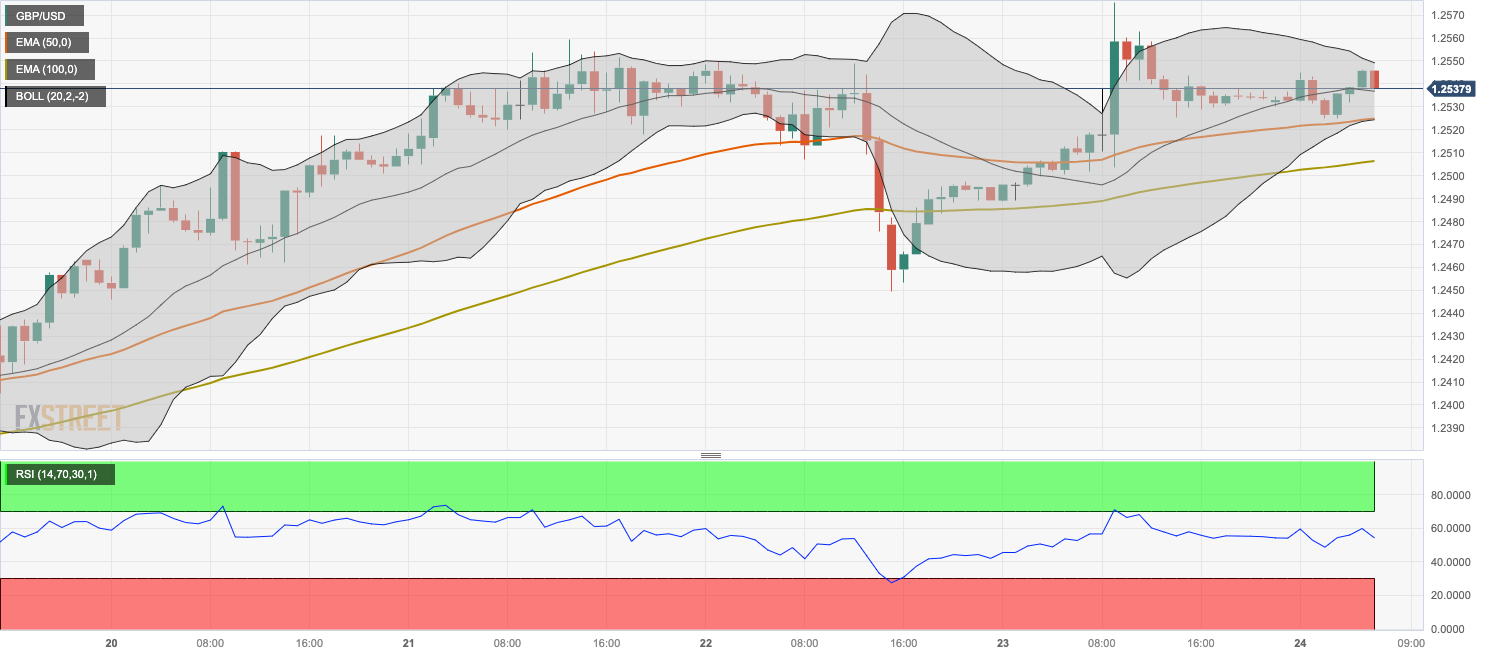
- GBP/USD gains traction near 1.2540 ahead of the US PMI data.
- The pair holds above the 50- and 100-hour EMA; the RSI indicator stands in bullish territory above 50.
- 1.2550 will be the first resistance level; the critical support level will emerge at 1.2525.
The GBP/USD pair gains ground to a two-month high of 1.2575 and then pulled back to 1.2540 during the Asian trading hours on Friday. The uptick of the pair is supported by the stronger-than-expected UK S&P Global/CIPS PMI data for November. The attention will shift to the US S&P Global PMI data, due later on Friday.
On Thursday, the preliminary UK S&P Global/CIPS Composite PMI grew unexpectedly in November, coming in at 50.1 in November from 48.7 in October, better than expected of 48.7. Additionally, the Manufacturing PMI improved to 46.7 versus 44.8 prior, while the Services PMI rose to 50.5 from 49.5 previously. The British Pound (GBP) surged against the US Dollar (USD) as the Bank of England (BoE) Governor Andrew Bailey suggested interest rates could remain higher for longer than priced by investors.
According to the four-hour chart, GBP/USD holds above the 50- and 100-hour Exponential Moving Averages (EMAs), suggesting the path of least resistance is to the upside. The upper boundary of the Bollinger Band at 1.2550 will be the first resistance level for the pair. The next hurdle is seen near a high of November 23 at 1.2575. Further north, the upside target to watch is a high of September 4 at 1.2642, followed by a high of September 1 at 1.2713.
On the downside, the critical support level will emerge at 1.2525, portraying the confluence of the lower limit of the Bollinger Band and the 50-hour EMA. A break below the latter will pave the way to the 100-hour EMA and a psychological round mark at the 1.2500–1.2505 region. Any follow-through selling will see a drop to a high of November 16 at 1.2456 and finally at 1.2400 (round figure).
It’s worth noting that the Relative Strength Index (RSI) holds in the bullish territory above 50, indicating further upside looks favorable.
(This story was corrected on November 24 at 08:13 GMT to say, in the first paragraph, that the GBP/USD pair gained ground to a two-month high of 1.2575, not 1.2569.)
GBP/USD four-hour chart

Source: https://www.fxstreet.com/news/gbp-usd-price-analysis-holds-positive-ground-below-the-mid-12500s-further-upside-looks-favorable-202311240617