Gold bugs will be happy to know the 5-year chart suggests a simple pause before new highs (see below).
Metals and miners could drop further over systemic market risk, but the technicals are starting to support a bottom.
Gold Price Forecast
Gold 5-Year daily chart
The cup-with-handle pattern looks complete. Prices fell deeper than anticipated, but I’m beginning to see signs of a bottom. I continue to expect a breakout above $2000 in the coming months; probably when the Fed pivots.

Gold daily chart
The close-up of the handle formation shows gold dipping briefly below the 200-day MA. Prices closed back above it Thursday, and I see the potential for a bottom if we see a strong finish above $1850.

Silver and Miners Analysis
Silver daily chart
Silver must get back above $22.50 to consider a cycle low.

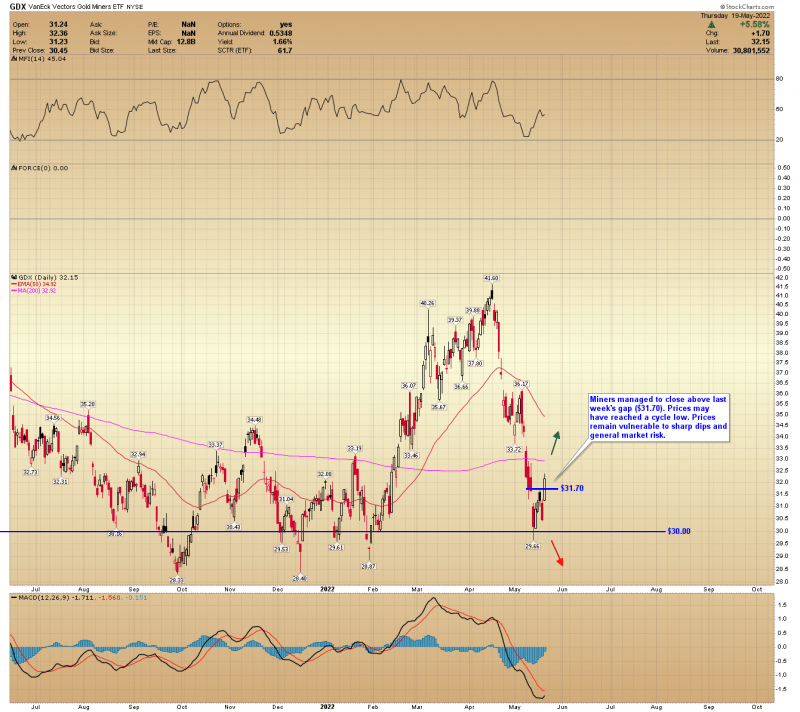
GDX daily chart
Miners managed to close above last week’s gap ($31.70). Prices may have reached a cycle low. Prices remain vulnerable to sharp dips and general market risk.

GDXJ daily chart
Juniors bounced sharply, supporting a possible low. A close above the gap near $41.50 is the next step in confirming a bottom.

Word of Caution: Markets are likely to remain volatile through 2022. Whatever happens today could swiftly reverse tomorrow. Try not to read too much into one week’s price action.
AG Thorson is a registered CMT and expert in technical analysis. He believes we are in the final stages of a global debt super-cycle. For regular updates, please visit here.
This article was originally posted on FX Empire
More From FXEMPIRE:
Source: https://finance.yahoo.com/news/gold-forecast-gold-prices-show-132353991.html