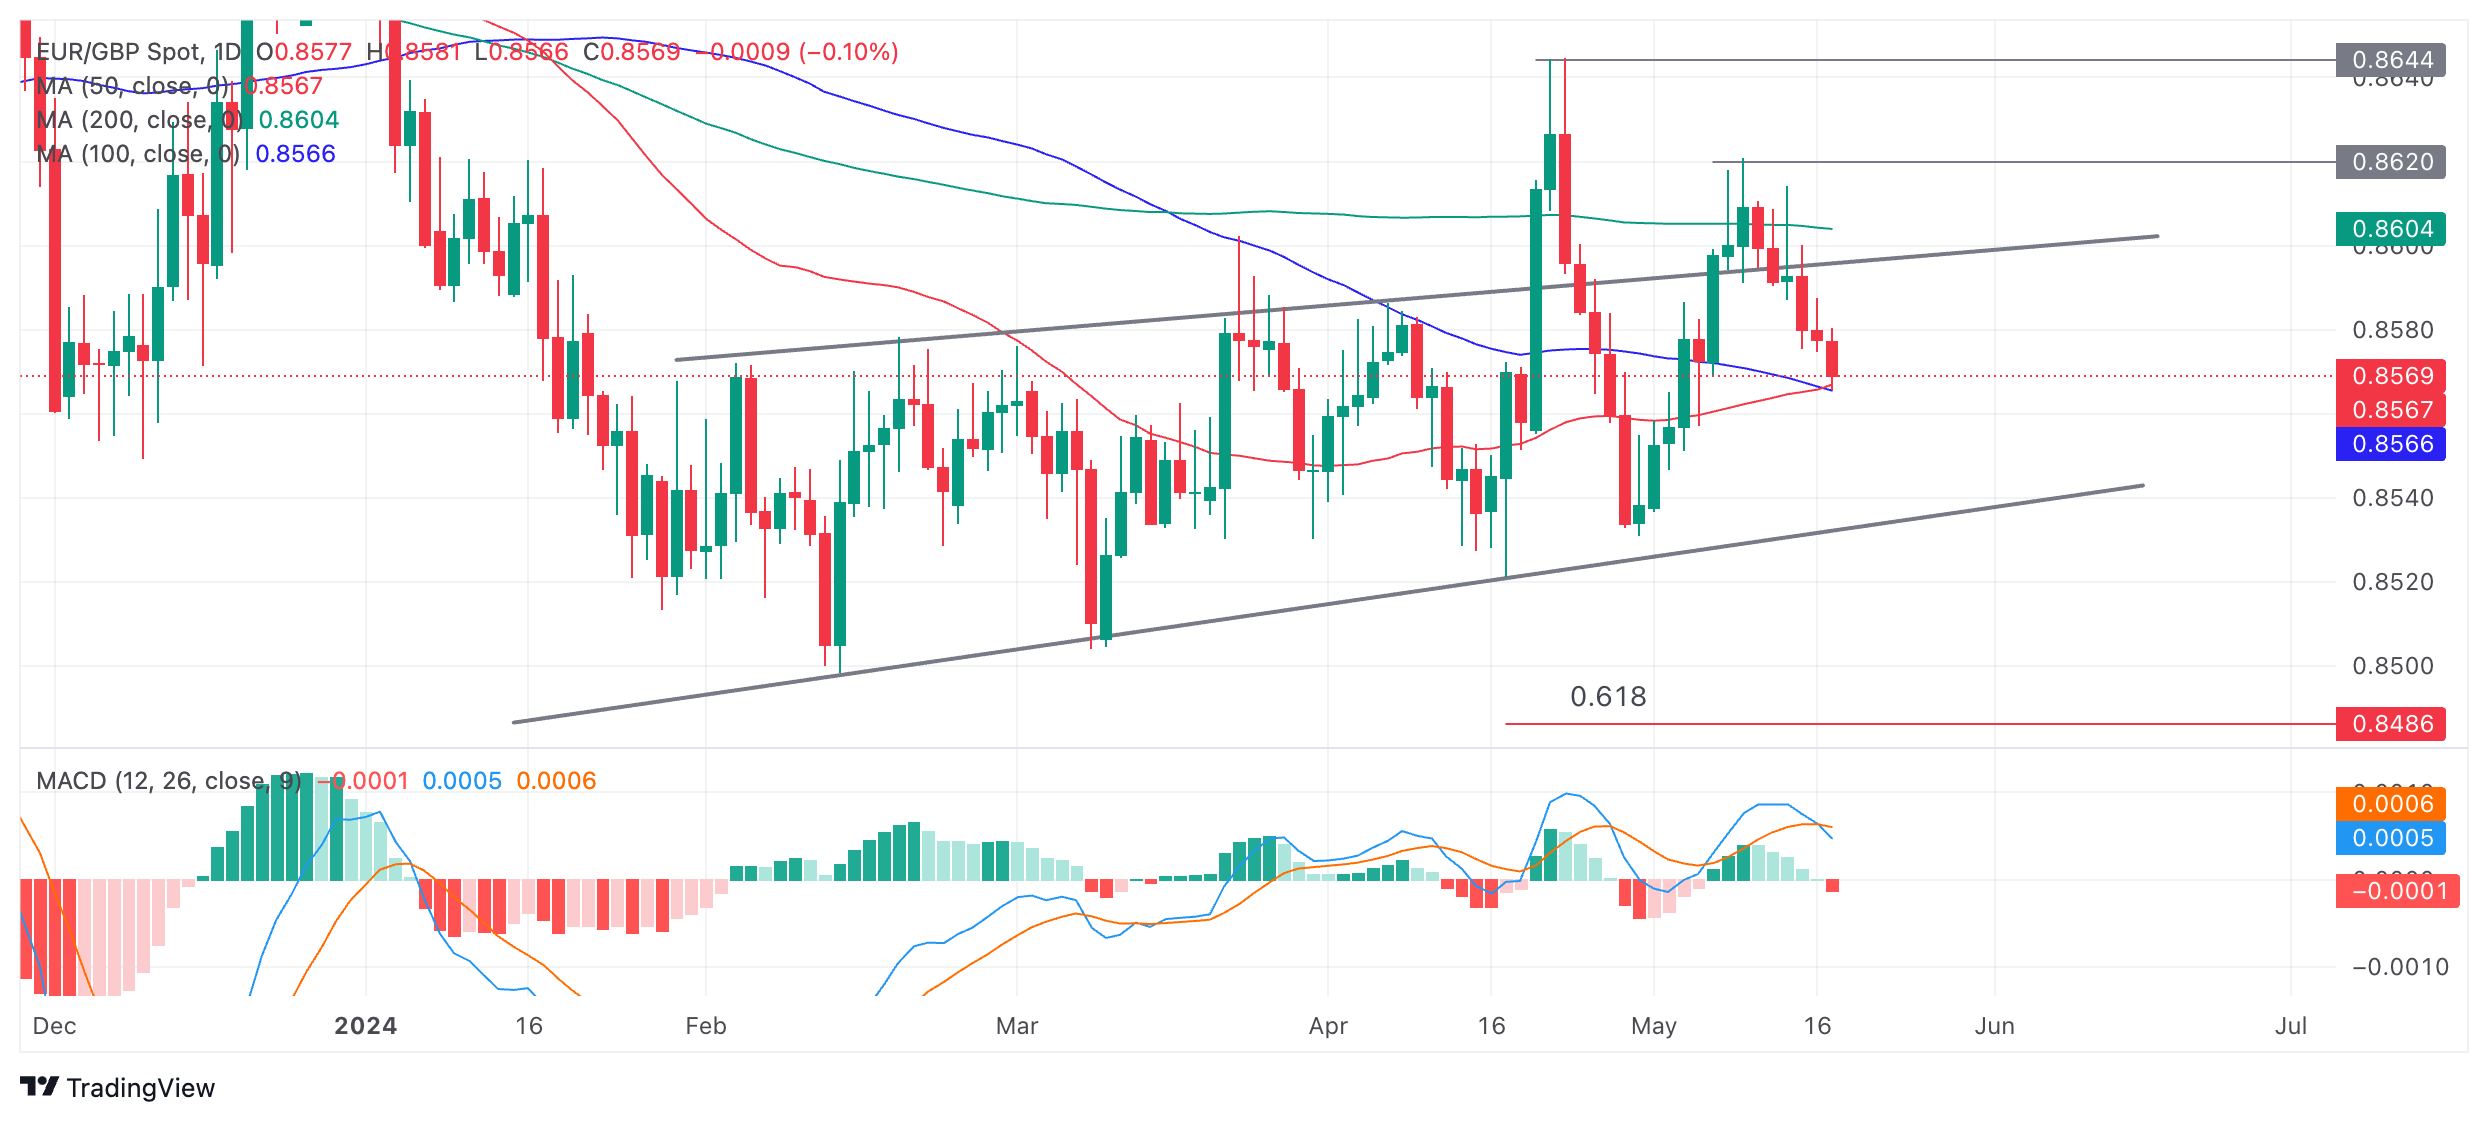
- EUR/GBP has declined to support from a cluster of Moving Averages.
- The pair has reached a pivotal level within a range that has been unfolding since January.
- In the absence of any bullish signs it could continue falling to the range floor as the sideways trend extends.
EUR/GBP has continued falling within a multi-month range that began in January 2024.
The pair has declined to support from two major moving averages – the 50 and 100-day Simple Moving Averages (SMA) – situated at 0.8566-67.
EUR/GBP Daily Chart

The Moving Average Convergence Divergence (MACD) indicator has crossed below its red signal line, providing further bearish evidence suggesting EUR/GBP could continue descending within its range/channel.
Given the bearish tone of the charts, EUR/GBP could now break below the support from the SMAs and continue falling to the range low at circa 0.8540.
There is also a possibility, however, that EUR/GBP could recover from support at the SMAs. If so, it could start rising to the ceiling of the range at 0.8600. At the moment, however, there is no indication from price action that such a bullish short-term reversal is underway.
Source: https://www.fxstreet.com/news/eur-gbp-price-analysis-finds-support-from-two-major-moving-averages-202405171247