- The token is trading above the resistance level on the daily time frame.
- DOT token has shown bullish actions in the previous sessions.
In the new year, it made a return, breaking beyond $5 on 9 January and settling down at around $4.90 on 11 January 2023. There were more than 1.15 billion DOT in circulation at the time, out of a total supply of 1,270,814,926. This gave the token a market valuation of around $5.66 billion, ranking it as the 14th biggest cryptocurrency by that metric.
DOT on the daily time frame
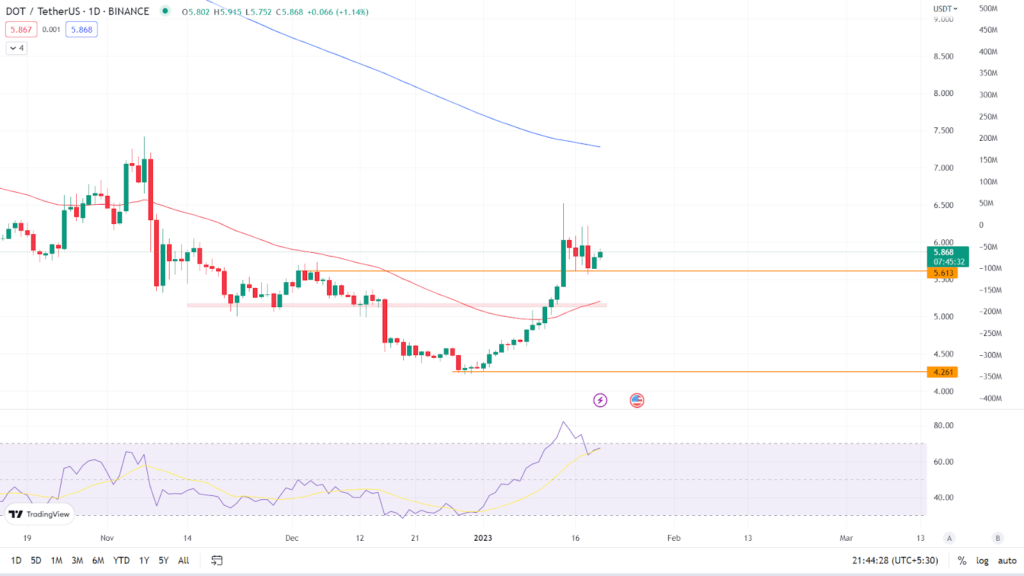
The token has broken through the resistance level and has sustained its position on the daily time frame. According to the daily chart, the DOT token is currently trading at $5.868 gaining 1.34% in the last 24 hours. It is trading between its two key Moving Averages, the 50 EMA and the 200 EMA. (Red line is 50 EMA and the blue line is 200 EMA). Over the last several days, the token has gained traction.
Relative Strength Index: The asset’s RSI curve is currently trading at 67.73, indicating that it is in the overbought zone. The rise in the token price has increased the value of the RSI curve. The RSI curve has crossed above the 14 SMA, indicating bullishness. If the token continues to rise in the coming days the RSI curve will remain in the overbought zone.

Analyst view & Expectations
The token has gained bullish momentum in recent days, with bulls driving up the token’s price. Investors who wish to buy today can do so since the token has sustained above the resistance level, with a short-term target of $7.150. Intraday traders, on the other hand, have a good opportunity to go long today and can book profits based on their risk to reward ratio.
Our most recent Polkadot (DOT) price forecast indicates that in the coming days, the value of Polkadot (DOT) will decline by -1.05% and hit $ 5.81. Our technical indicators indicate that the current sentiment is neutral, while the Fear & Greed Index reading is 51. (Neutral). Over the past 30 days, Polkadot had 11.65% price volatility and 19/30 (63%) green days. According to our Polkadot prediction, now is a good time to buy Polkadot.
Technical Levels
Major support: $5.613
Major resistance: $6.074 & $7.150
Conclusion
The token appears to be in a strong position to buy as it has gained bullish momentum and is forming a bullish chart pattern. It remains to be seen if the bulls can maintain their momentum.
Disclaimer: The views and opinions stated by the author, or any people named in this article, are for informational ideas only, and they do not establish the financial, investment, or other advice. Investing in or trading crypto assets comes with a risk of financial loss.

Steve Anderson is an Australian crypto enthusiast. He is a specialist in management and trading for over 5 years. Steve has worked as a crypto trader, he loves learning about decentralisation, understanding the true potential of the blockchain.
Source: https://www.thecoinrepublic.com/2023/01/21/dot-price-prediction-bulls-are-on-the-move-as-they-break-through-the-resistance-level/