Chainlink price analysis over the past 24 hours reveals a positive breakout from the $5.98 mark, proving the token is trending upward. Today has been in an upswing as well, with the price rising by 0.46 percent as the bulls have remained strong. Although the bears were leading the market the previous day, the current market trend is supporting the bulls. A further upward trend for the LINK/USD pair is expected in the upcoming hours. Resistance for LINK is at $5.98; if this level is broken, the coin may move toward $6.00 and possibly higher. The 24-hour trading volume has increased by 27.51% and is currently at $141,579,124, and the market capitalization is trading at $3,036,232,339
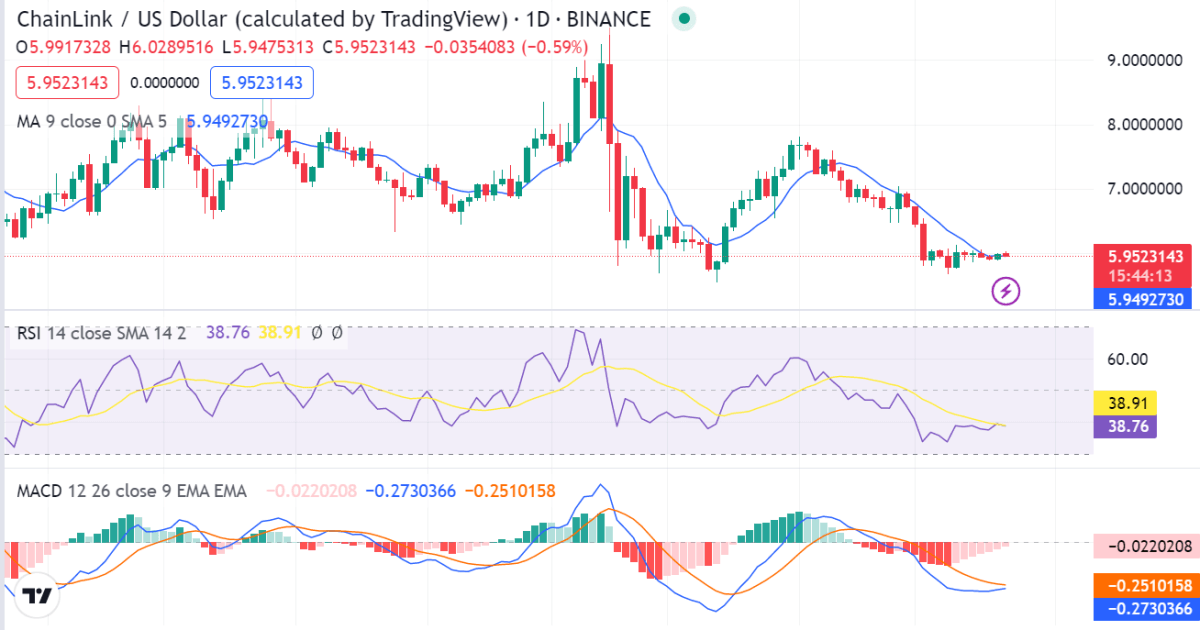
Chainlink 1-day price chart: LINK/USD shows bullish signal as prices rise to $5.98
Looking at the daily chart, the Chainlink coin is under heavy buying pressure and producing a bullish pennant pattern. Before breaking past a barrier level, the price swings in an upward-trending channel, forming a bullish pennant pattern. The price of the currency is currently $5.98 at the time of writing, however, there is potential for further price hikes.

According to Chainlink’s technical analysis, the coin is now in a strong bullish trend and is most likely to keep moving upward. The Relative Strength Index (RSI) indicator is currently at 38.91, indicating the token is overbought. However, the Moving Average Convergence Divergence (MACD) shows that the trend is still in an uptrend and the coin is likely to continue its bullish momentum. The 200-day moving average (MA) is currently resting at $5.9523, and the 50-day MA is hovering around $5.949, providing strong support to the LINK.
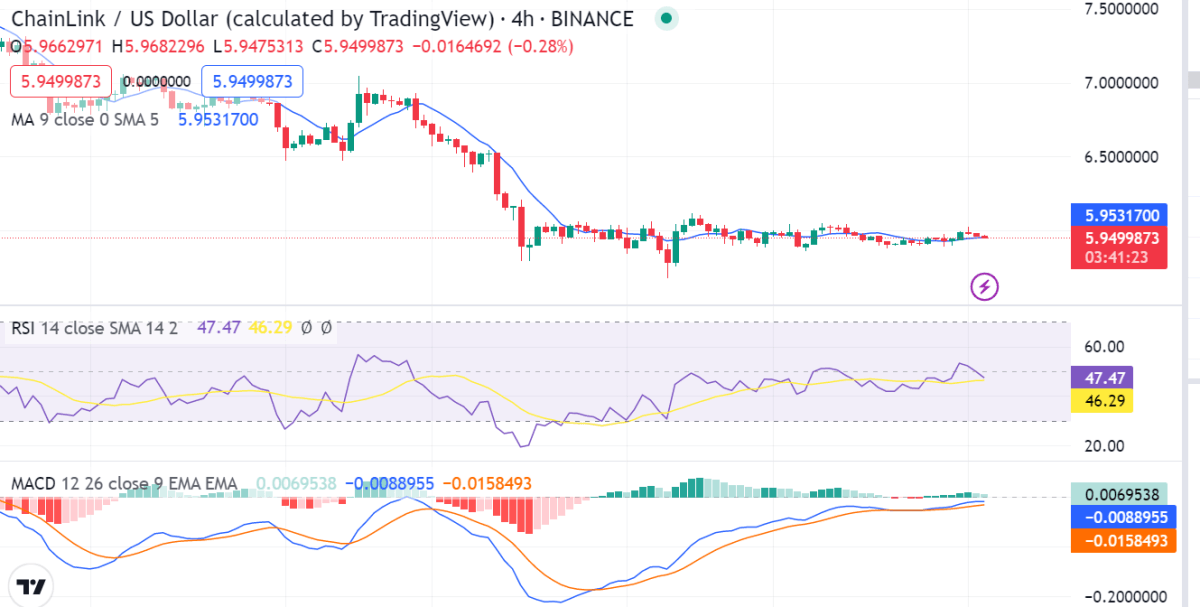
LINK/USD 4-hour price analysis: Prices rise to $5.98 as bulls take control.
The 4-hour price report for Chainlink price analysis also demonstrates bullish momentum because the bulls are successfully maintaining their advantage. The LINK value has somewhat increased over the last couple of hours; at the time of writing, it is $5.98 and is now appearing to be in an upward trend. The LINK/USD pair has increased by around 0.46 percent since the start of the current session.

The Relative Strength Index (RSI) on the 4-hour chart is currently at a value of 46.29, showing a slight increase in prices. The moving average indicator (MA) shows that the 50-period MA is still above the 200-period MA, indicating bullish momentum in the market. The Moving Average Convergence Divergence (MACD) indicator is also moving upward, indicating that a further rise in price will occur during the next few days.
Chainlink price analysis conclusion
According to the massive price gain in the one-day and four-hour Chainlink price analysis, the bullish momentum is progressively stabilizing. The cost is trading at $5.98, and future price increases are expected. The hourly chart suggests a significant price increase for Chainlink, which is good news for buyers as it is expected that the price will rise for the next 24 hours. It is projected that Chainlink would break out upward from the current consolidation phase.
Source: https://www.cryptopolitan.com/chainlink-price-analysis-2022-12-26/
