Chainlink price analysis reveals that LINK prices opened the daily trading session trading at the $7.26 level and slipped below the $7.01 level within the first hour of trading as market conditions turned bearish. LINK prices found support at the $6.98 level and have been consolidating around this level for the past few hours. Chainlink prices have been countered by strong resistance at the $7.26 and they currently trade at $7.01.
Chainlink price analysis for today shows a negative market sentiment revealed after LINK prices broke off downwards from a sideways trend that had been present for the past few days. The total trading volume for LINK is nearly $288 million and the market capitalization for LINK is currently $3.44 billion. The digital asset is occupying 3.36 percent of the entire crypto market as it ranks in position 22 according to Coinmarketcap.
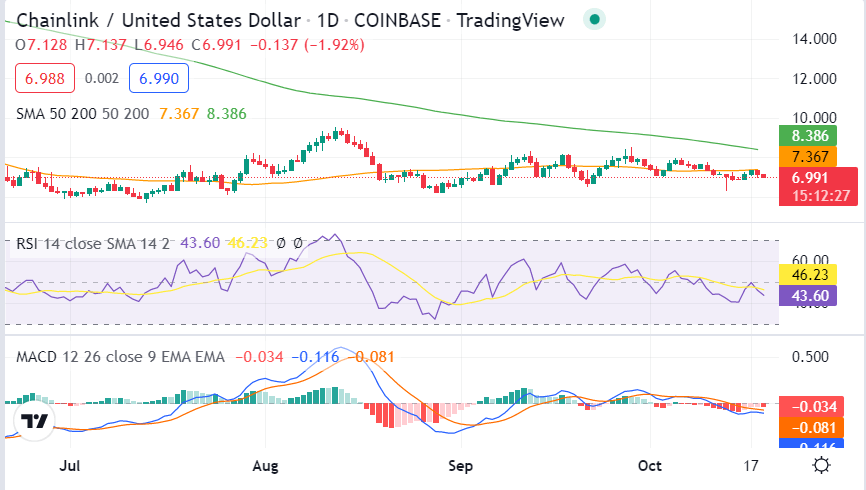
Chainlink price action on a 1-day price chart: Bears adamant as they push prices below $7.01
The 1-day Chainlink price analysis shows that since the beginning of trading today, LINK prices have been on a downward trend as market conditions turned bearish. The price has been struggling to break out of the $7.26 resistance level for the past few days, and as a result, the token has begun to fall.

The 50 SMA line is currently below the 200 SMA line, which indicates that the path of least resistance is to the downside. The RSI indicator is currently at 46.23 and is indicating that the token is oversold. This means that there could be a small bounce in prices before the bearish trend resumes. The MACD indicator is also showing bearish momentum as the MACD line is below the signal line.
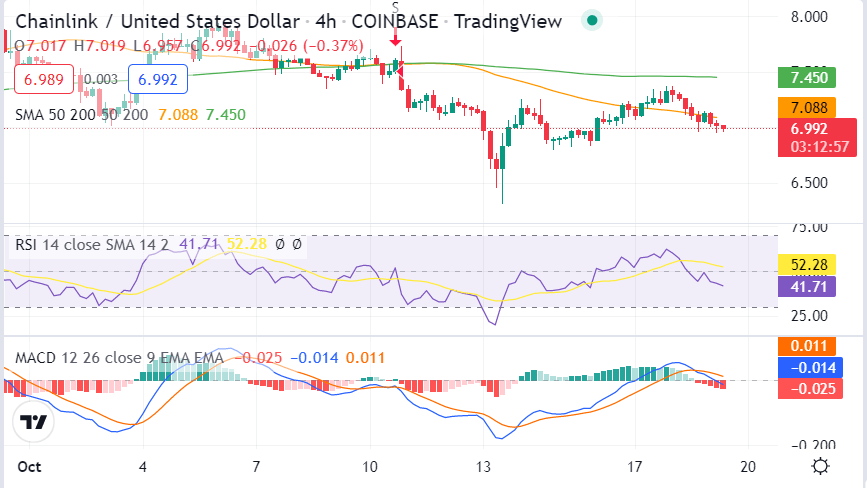
LINK/USD 4-hour price analysis: Latest developments
In the 4-hour Chainlink price analysis chart, we can see that LINK has formed a symmetrical triangle pattern. This is a neutral pattern and indicates that the market is undecided at the moment. The token has been fluctuating between the $7.26 resistance level and the $6.98 support level for the past few hours.

The 4-hour 50 SMA line is currently at $7.02 while the 200 SMA line is at $6.79. This indicates that the path of least resistance is to the downside and that the token is likely to break below the $6.98 support level in the near future. The RSI indicator is currently at 52.28 and is showing no clear trend. The MACD line blue is currently above the signal line, which indicates bearish momentum in the market. The final Chainlink price analysis shows that the token is likely to continue its downward trend as the bears remain in control of the market.
Chainlink price analysis conclusion
Today’s Chainlink price analysis reveals that the digital asset is currently in a bearish trend as market conditions turned bearish. The bears seem to be in control of the market as they push prices lower. However, a slight rebound cannot be ruled out as the market conditions are currently oversold. The key support levels to watch out for are $6.98 while the immediate resistance is at the $7.26 level. Bulls are expected to come out to defend the $7.26 level as the market conditions turn bullish in the short term.
Source: https://www.cryptopolitan.com/chainlink-price-analysis-2022-10-19/