Cardano price analysis is bullish today as an increase in price has been noted today after a heavy loss the previous week. Bulls are successfully maintaining their lead today after breaking the price upwards at the start of today’s trading session, following a downtrend some days back. The overall trend line is still downwards, but bulls have provided good support to the price. ADA/USD has comparatively shown good performance today as most altcoins are either in loss or facing trouble in upwards movement.
Cardano price analysis 4-hour price chart: ADA trades at $0.2638 after a bullish run
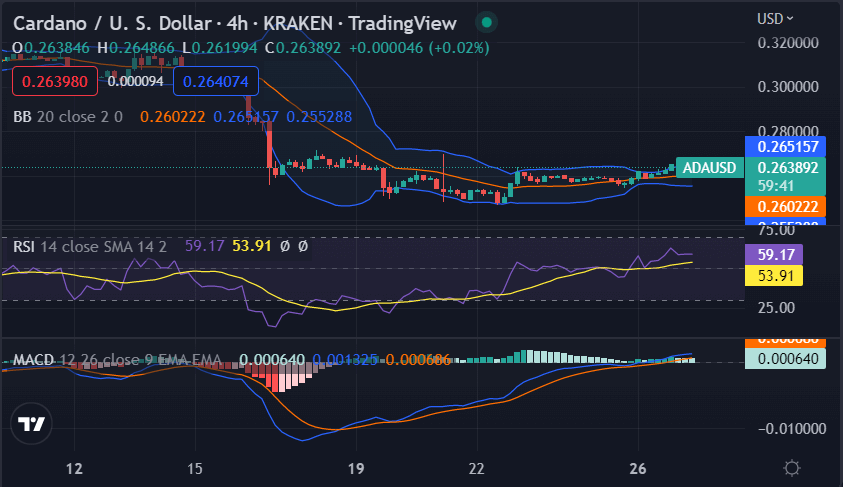
The four hours Cardano price analysis is showings signs of a solid bullish trend, as the price has increased significantly. After the last price correction observed yesterday, the trend reversed in favor of the bullish side, as the bulls were leading the price chart earlier. Additionally, an upward trend has been observed in the last four hours, as the price has moved up to the $0.2638 level after swinging as high as the $0.266 resistance level.

The MACD line is above the signal line, which indicates that the bulls are in control of the market momentum. The Relative Strength Index on the 4-hour price chart is currently near the 50-level, which indicates that the market is in the overbought region. However, since the RSI is not at extreme levels, there is still some room for prices to move higher. The bulls have been in control of the market as the Bollinger Bands are moving above the candlesticks.
ADA/USD 1-day price chart: Bullish rally takes the price up to $0.2638
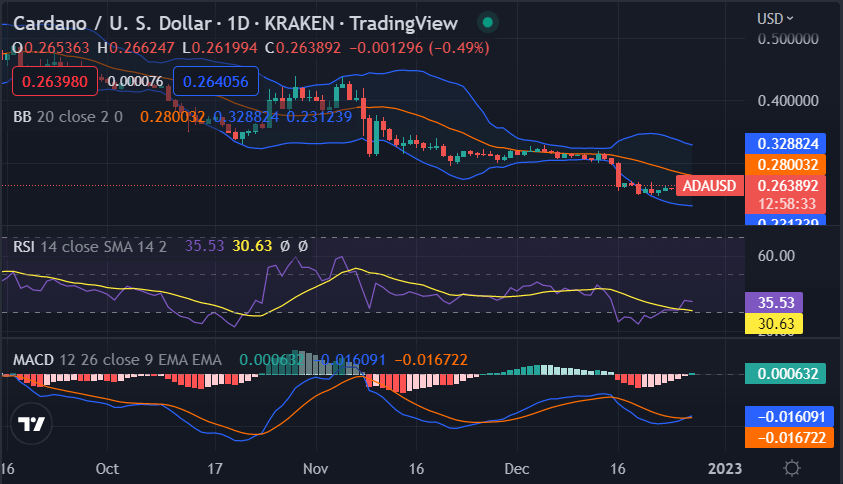
The 1-day price chart for Cardano price analysis shows a significant gain in price, as the cryptocurrency is trading hands at $0.2647 at the time of writing. and has gained a value of more than 1.45 percent over the last 24 hours The trading volume has decreased by 7.57 percent in the last 24 hours as it is currently sitting at $140,554,649, indicating the interest level of the trader, while the market cap shows an improvement of 1.47 percent, which is currently at $9,132,434,016.

The MACD histogram is also in green, which indicates that the bulls have the upper hand in the market at the moment. The Relative Strength Index is currently at the 30.63 level, which indicates that the market is neither overbought nor oversold. The Bollinger Bands are also expanding, which is indicative of increased market volatility.
Cardano price analysis conclusion
The Cardano price analysis shows the price has been rising for the last 12 hours, as bulls are controlling the price function today. Traders can expect the ADA/USD pair to continue upside down in the coming hours, and ADA may break near $0.266 today if the bullish momentum continues.
Source: https://www.cryptopolitan.com/cardano-price-analysis-2022-12-27/