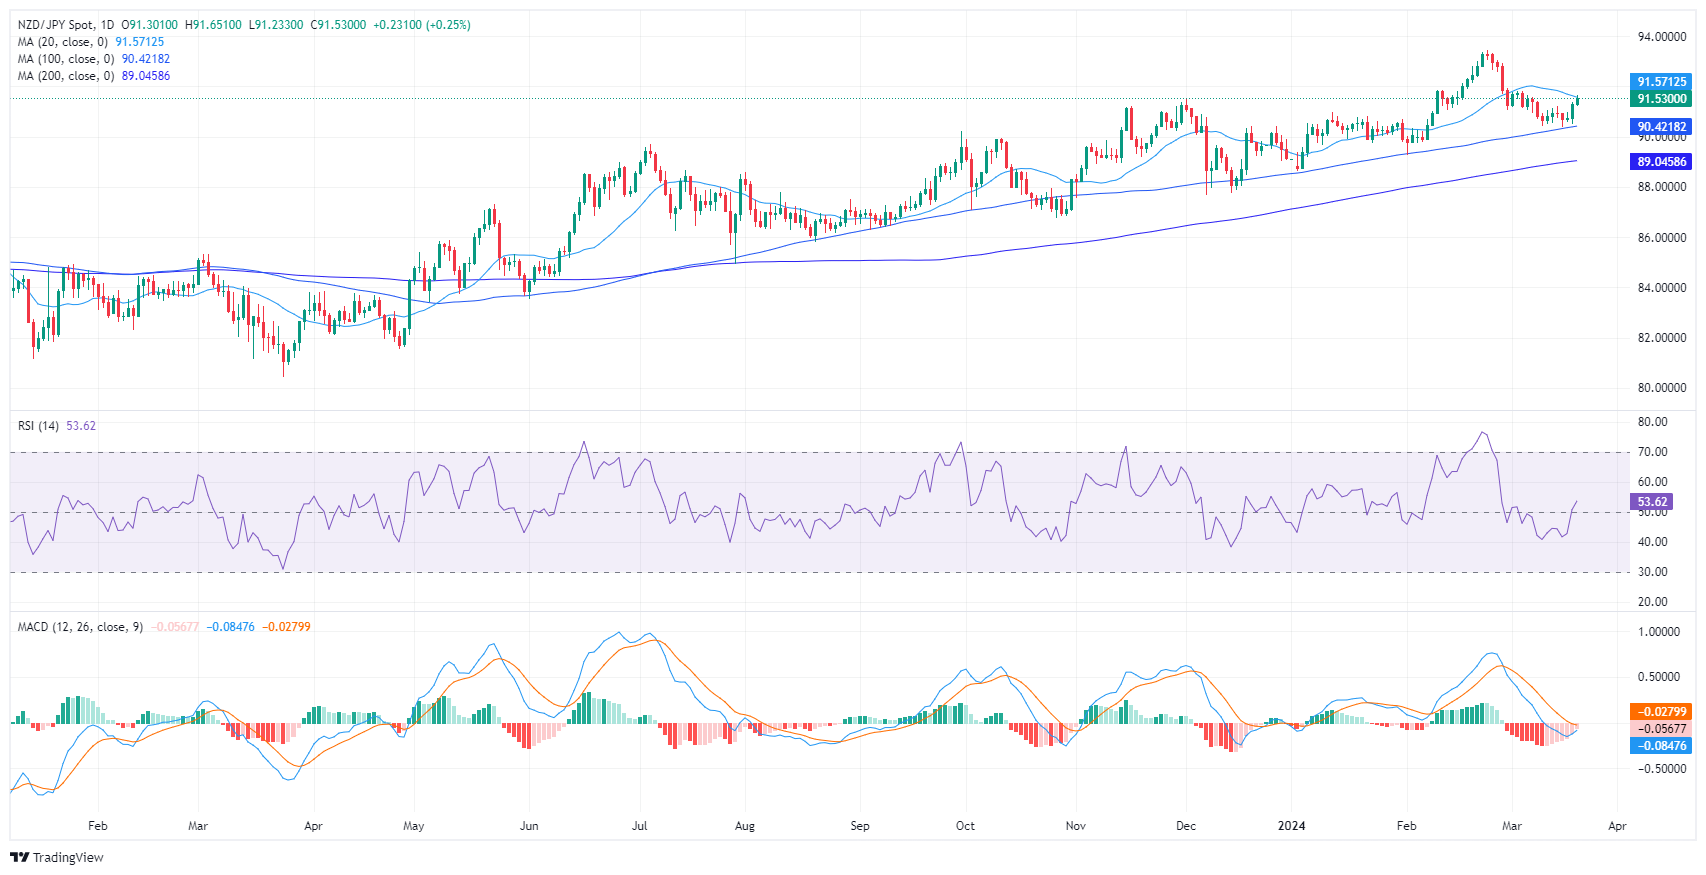
- The daily chart reveals bullish sentiment, with RSI on an upward trajectory out of the negative zone and MACD depicting decreasing red bars.
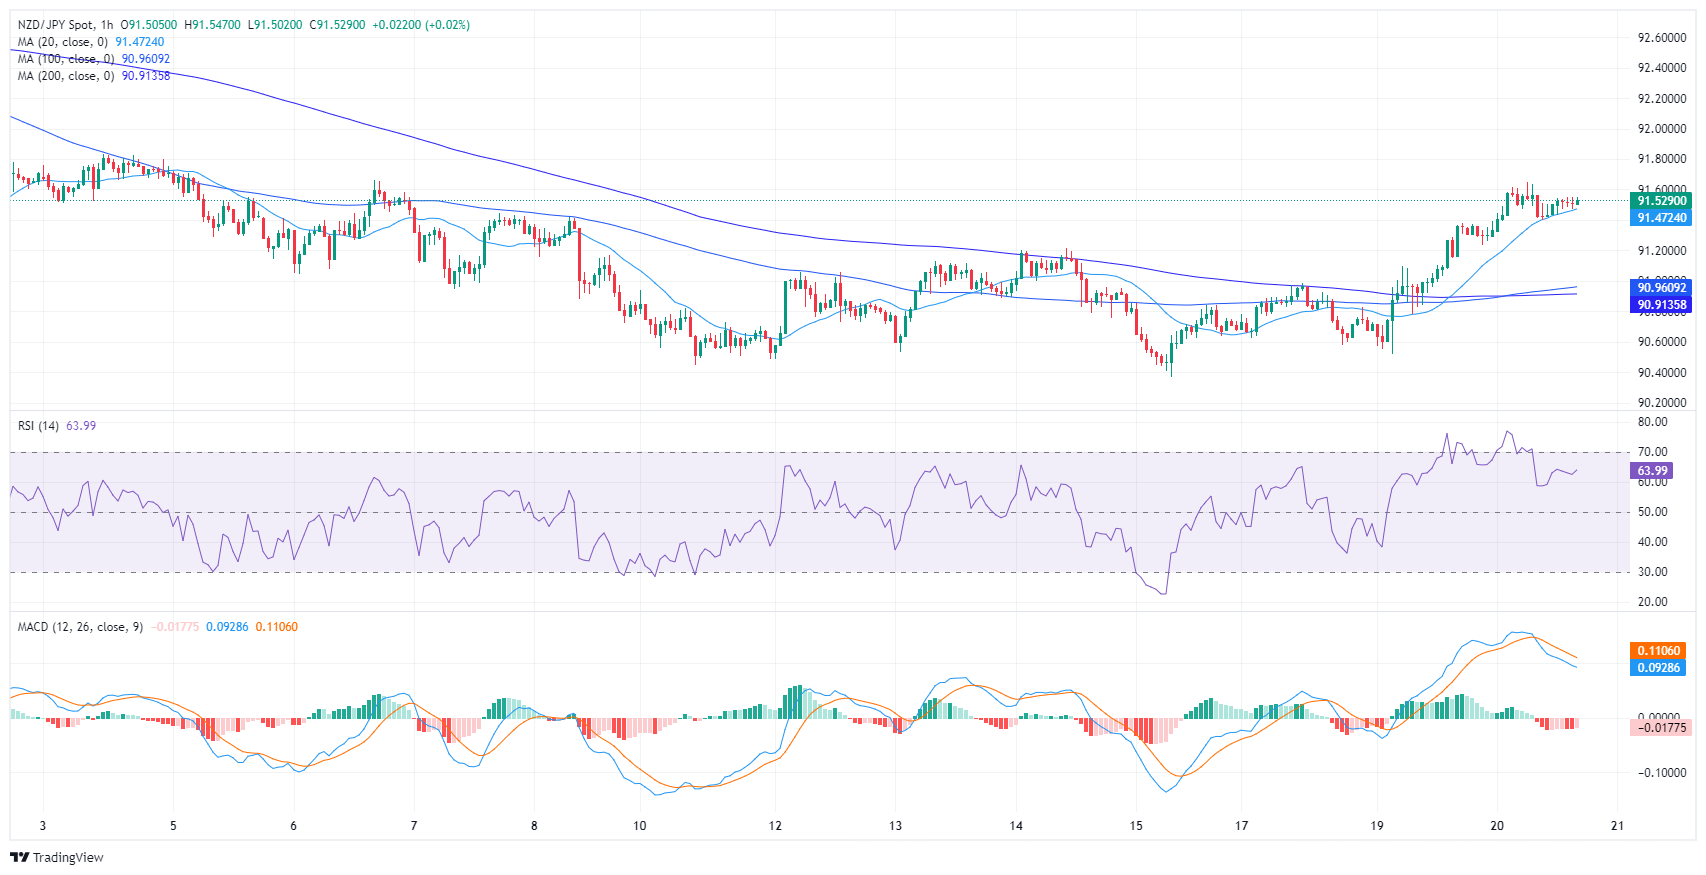
- Indicators are consolidating overbought conditions on the hourly chart.
- Bulls must recover the 20-day SMA to confirm a recovery.
The NZD/JPY currency pair is trading at 91.54, showing gains in Wednesday’s session. The broader technical landscape suggests the buyers. Despite recent bearish activity pushing the pair below the 20-day Simple Moving Averages (SMAs), the pair remains aloft of the 100 and 200-day SMAs, indicating an enduring bullish control.
On the daily chart, the NZD/JPY pair exhibits relatively bullish momentum. The Relative Strength Index (RSI) indicates a positive trend with an upward slope, moving above the negative territory. This, combined with the decreasing red bars from the Moving Average Convergence Divergence (MACD) which indicates declining negative momentum, suggests the buyers are gaining the upper hand over sellers.
NZD/JPY Daily Chart
Transitioning to the hourly chart for the NZD/JPY presents a slightly different scenario. Here, the RSI consistently indicates positive with minor fluctuations, hinting at strong buying momentum but consolidating after entering in the overbought area during the European session. Meanwhile, the MACD reveals flat red bars, signifying stagnant negative momentum suggesting that the buyers are gearing up for the next upward leg.
NZD/JPY Hourly Chart
Source: https://www.fxstreet.com/news/nzd-jpy-price-analysis-bulls-are-firmly-in-control-according-to-daily-trends-houly-indicators-consolidate-202403201638