- Rising seller traction is prevalent in the daily chart with the RSI deep in the negative area.
- The hourly chart signals a potential shift toward short-term bullish correction.
- The overall trend continues to be tilted to the downside.
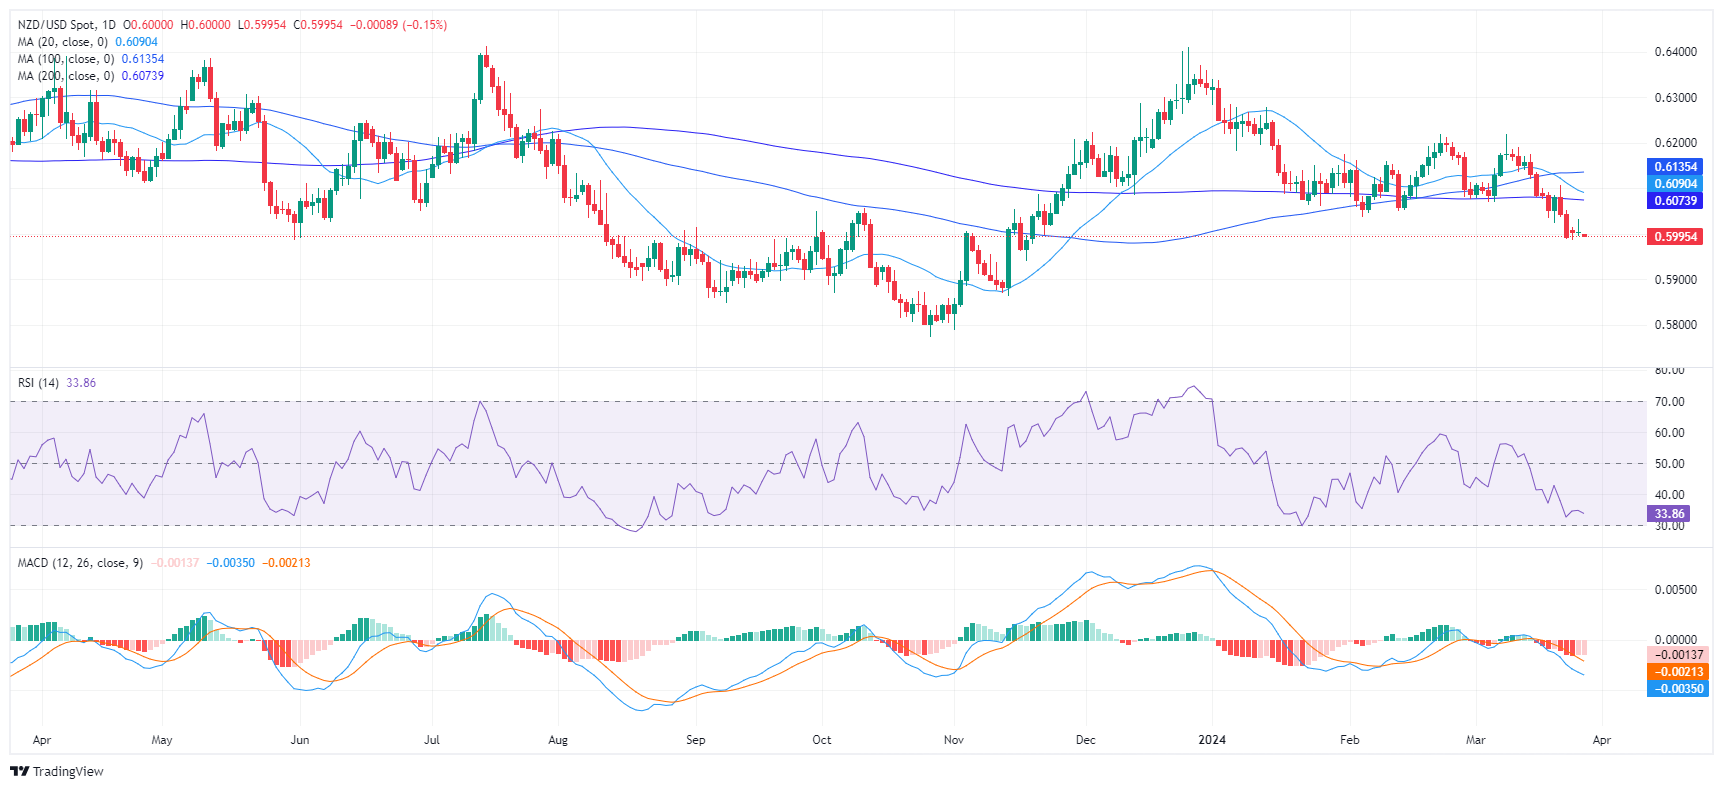
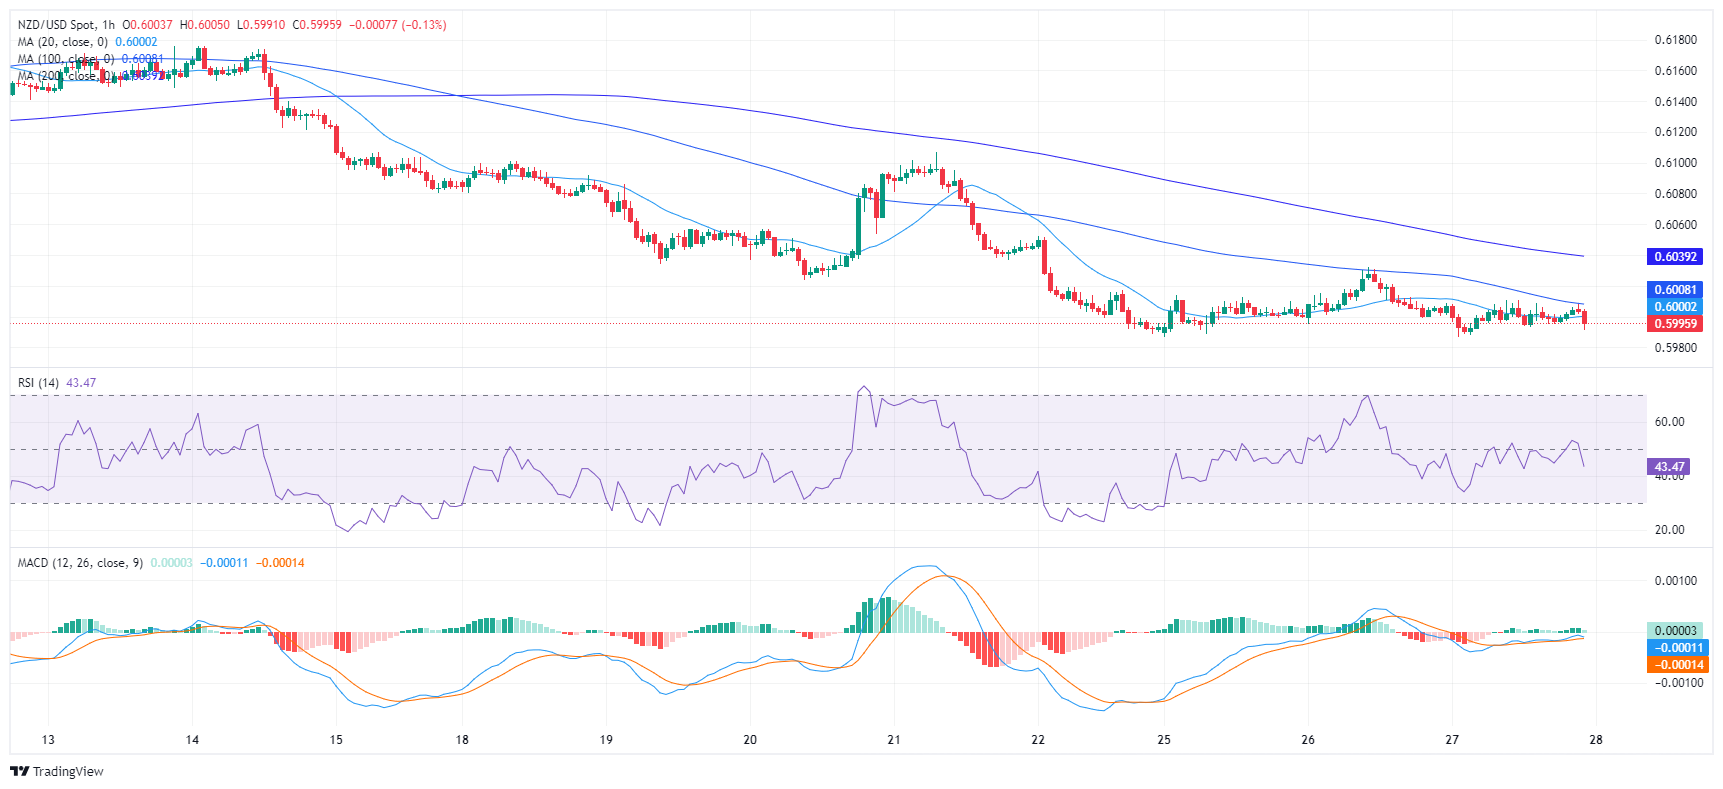
The NZD/USD pair is operating at around 0.6000 with losses, The market landscape is primarily dominated by sellers, underscored by a prevailing negative trend. The pair resides below the important 20, 100, and 200-day Simple Moving Averages (SMAs), emphasizing the strong presence of sellers. However, the hourly chart has clues for a potential short-term bullish reversal.
The Relative Strength Index (RSI) oscillates within the negative territory on the daily chart. at 35 near the oversold area, underscoring the prominence of sellers in the market. Concurrently, the predominance of flat red bars in the Moving Average Convergence Divergence (MACD) histogram affirms this negative momentum.
NZD/USD daily chart

Switching to the hourly chart, the RSI moved towards its middle point but then retreated towards 40, implying a modest bias towards the buyers. In addition, the MACD histogram prints green bars which offer additional evidence of buyers gathering momentum.
NZD/USD hourly chart

Overall, the current dynamics of the NZD/USD pair infer a predominantly negative momentum. Nevertheless, the recovering indicators in the hourly chart point to a possible bullish reversal in the short term. Zooming out, the buyers must make a stride to reclaim the 200-day SMA at 0.6070 to avoid additional losses.
Source: https://www.fxstreet.com/news/nzd-usd-price-analysis-bears-exert-pressure-yet-short-term-bullish-reversal-seems-possible-202403272206