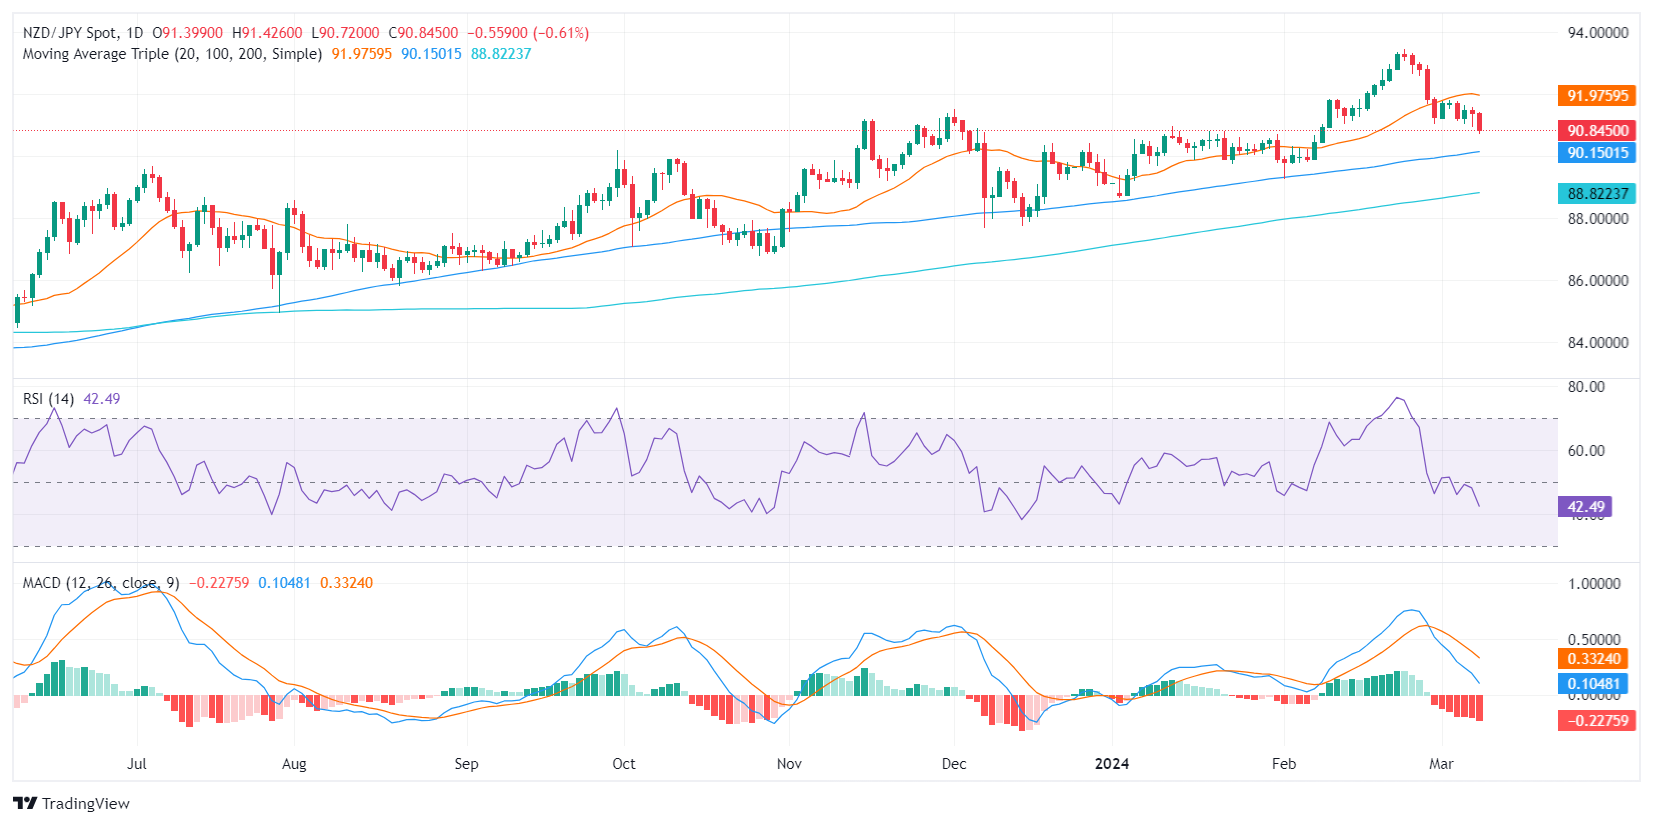
- Indications from the daily chart imply a dominance by sellers for the short term.
- The same indicators on the hourly chart also imply a bearish momentum, although depicting potential signs of diminishing selling traction.
- The hourly RSI is recovering after hitting oversold conditions earlier in the session.
In Friday’s session, the NZD/JPY pair is currently changing hands at 90.84, down 0.50%. The technical outlook for the pair points to strong control from sellers. Even though the market has been under a selling spree, recent conditions hint at a potential weakening of this selling pressure.
Based on the indicators of the daily chart, the NZD/JPY pair appears to be dominated by sellers. The Relative Strength Index (RSI) remains within negative territory. Additionally, the rising red bars on the Moving Average Convergence Divergence (MACD), which suggest negative momentum, strengthen the belief of ongoing bearish sentiment.
NZD/JPY daily chart

Shifting attention to the hourly chart, the RSI oscillates near the oversold territory, indicating heavy selling pressure. However, the recent uptick in the RSI value might suggest seller fatigue. Combined with the decreasing red bars in the MACD histogram, this demonstrates a possible loss in the pace of negative momentum.
NZD/JPY hourly chart

In conclusion, there is consistency between the daily and hourly charts, both implying bearish momentum in NZD/JPY. However, the latest hourly indicators hint towards a possible slowdown in the selling pressure – a divergence that traders should keep an eye on. In addition, the overall trend continues to favor the buyers as the cross remains above the 100 and 200-day Simple Moving Averages (SMAs). The fact that it sits below the 20-day Average adds negativity to the short-term outlook.
Source: https://www.fxstreet.com/news/nzd-jpy-price-analysis-bearish-sentiment-rules-potential-seller-fatigue-signals-a-pause-202403081952