Today Avalanche price analysis shows that the cryptocurrency has surged to $13.68 following a strong bullish run. The rise in price is likely a result of increasing demand from investors and traders, as well as positive market conditions. AVAX/USD has gained 2.16 percent in the last 24 hours, indicating strong upward momentum for the coin.
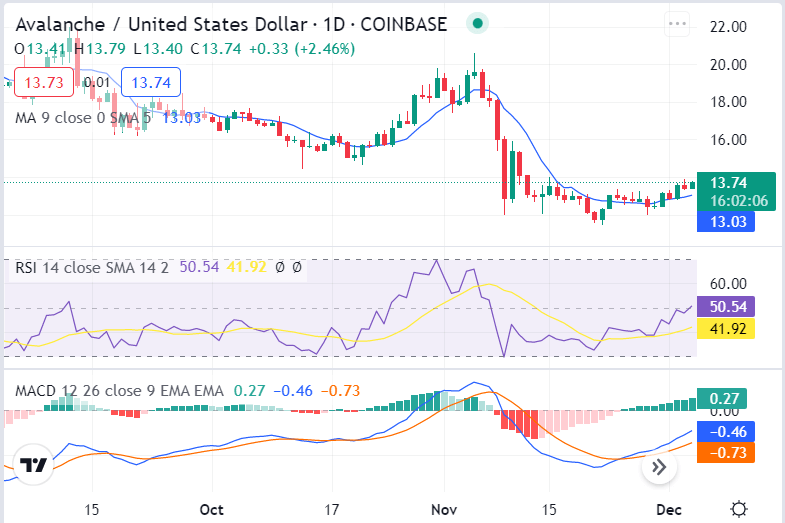
AVAX/USD 1-day price chart: Bulls are continuing to push prices higher as the altcoin hits $13.69
The 1-day Avalanche market analysis reveals that prices have risen since the start of the day and currently sit at $13.86. For a few days now, Avalanche prices have been caught in between $13.32 and $13.86 as bulls and bears argue for power over the market. If bullish momentum continues, then it’s probable we’ll see more progress in the upcoming days. The 24-hour trading volume has increased to over $4.244 million, which indicates growing investor interest in the coin, with a market cap of $163 million.

The 50-day moving average is currently flat, but the 200-day moving average is still rising. This indicates that the long-term trend is still bullish. The RSI is below 41.92, which means there’s space for market growth before it becomes overbought. Currently, the MACD line is above the signal line; this suggests that the market is in a strong uptrend.
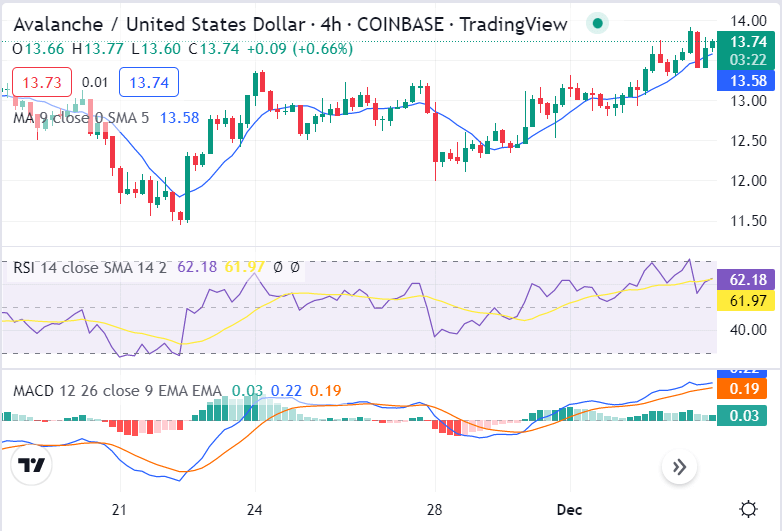
Avalanche price analysis on a 4-hour price Chart: The current trade value for AAVE/USD is $13.32
The 4-hour Avalanche price chart shows that the market has formed an ascending parallel channel and is trading at the upper boundary. Prices have recently broken out of a symmetrical triangle pattern, which is typically bullish. The market may retrace back to the $13.32 level before resuming its upward move. However, if prices break below $13.32, this would be a bearish sign, and control of the market could shift to the bears.

The recent RSI on 4-hour markets indicates that a correction might be necessary, as it is currently in the overbought region at 61.97. The MACD line indicator backs up this claim, as it is above the signal line and losing momentum, although still in a strong uptrend. Additionally, both the 50 and 200 moving averages are rising steadily-just less so than before-which suggests that while the short-term trend isn’t as bullish, overturning the long-term trend entirely seems unlikely based upon these.
Avalanche price analysis conclusion
In conclusion, the Avalanche price analysis suggests that the market is experiencing a bullish trend, with prices expected to surge higher in the coming days. While it may be difficult for the market to sustain these levels, overall sentiment remains bullish. Technical indicators favor further upside growth in the short term.
Disclaimer. The information provided is not trading advice. Cryptopolitan.com holds no liability for any investments made based on the information provided on this page. We strongly recommend independent research and/or consultation with a qualified professional before making any investment decisions.
Source: https://www.cryptopolitan.com/avalanche-price-analysis-2022-12-04/