Avalanche price analysis shows a downward trend today as the prices decline below $10.87. The price of Avalanche has support around $10.70, and if this support level is broken, it could go as low as $10. At $11.20, the AVAX/USD pair encounters resistance. If this level is broken, the price can increase to $11.22. The AVAX/USD pair anticipates a price decrease because the bears have reemerged. The trend line has been descending for the past few days. The price of the cryptocurrency has dropped by more than 2.88% over the past 24 hours.
Avalanche price analysis 1-day chart
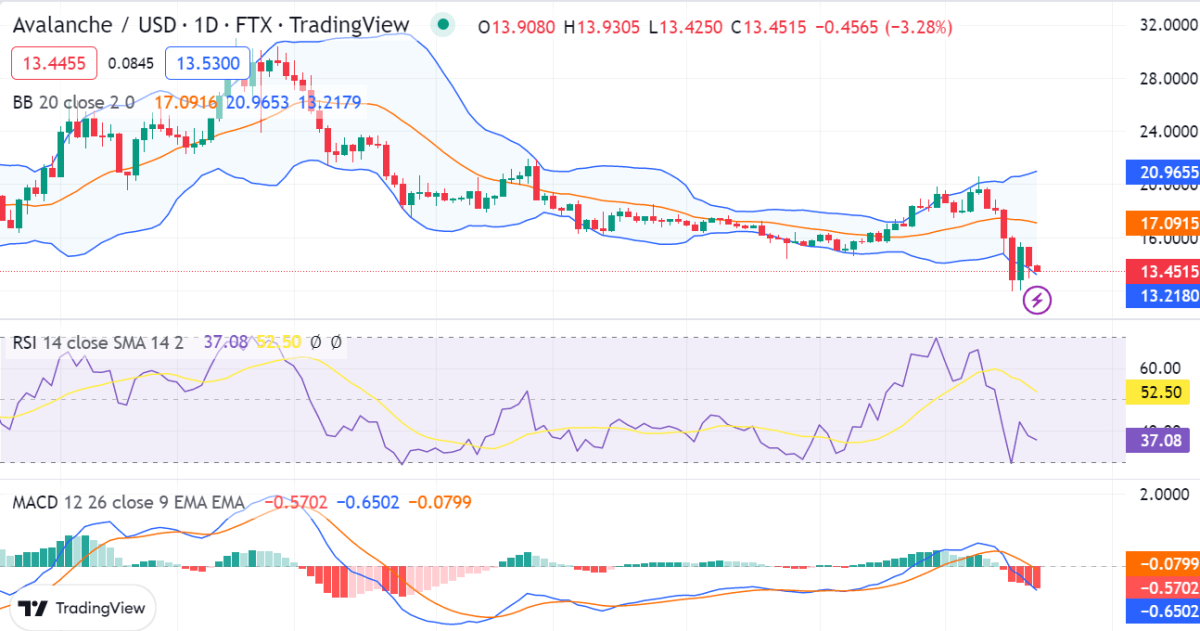
The avalanche price analysis on the 24-hour price analysis is once again moving downward. Today’s price drop to $10.87 represents a significant loss for the cryptocurrency, which has lost 2.88 percent of its value over the past 24 hours. With a market cap of $3.3 billion for AVAX/USD and a current 24-hour trading volume of $123 million, there has also been a decline in volume. As the bearish momentum grows stronger over time, further price declines are anticipated.

The relative strength index (RSI) is currently at 52.50, which indicates that the market is neither overbought nor oversold. Moreover, the moving average convergence and divergence (MACD) line is below the signal line, indicating that the market is still bearish. The value of the lower Bollinger band is $13.2179, indicating support for the price of cryptocurrencies, while the value of the upper Bollinger band is $20.9653, signifying resistance.
AVAX/USD 4-hour price chart: Latest development
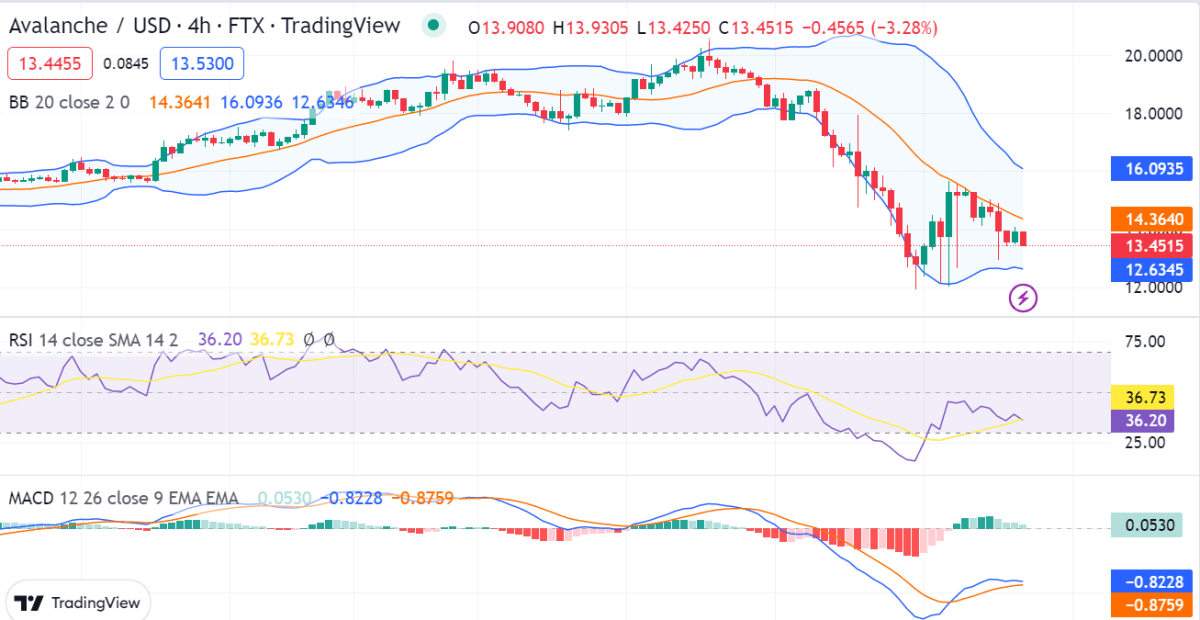
The 4-hour Avalanche price analysis shows that the prices have dropped to $10.87, which indicates that the market is negative. A bearish trend that has been strengthening over the past four hours is causing the price to decline once more. The price has been moving in a bearish direction for the past 24 hours, as can be seen on the charts, which show a consistent decrease in price levels. The market volatility is increasing as the Bollinger bands are stretching outwards, indicating a negative momentum.

The upper Bollinger band is showing a $16.0936 reading, and the lower band is showing a $12.6346 mark. The relative strength index RSI curve is headed downward at index of 36.73, as the bearish pressure seems immense. The signal line (red) is above the MACD line (blue), which shows a downward trend.
Avalanche price analysis conclusion
In conclusion, Avalanche price analysis shows that the market has had a significant sell-off and that prices at higher levels have not been able to attract any purchasers. As of right now, the market is consolidating and is trading between $10.87 and $10.86. The market is particularly unstable as a result of the wide range of price variations. The bears are seen as being in control of the market as they work to force prices lower.
Source: https://www.cryptopolitan.com/avalanche-price-analysis-2022-12-30/