- AUD/USD extends its winning streak on weak US Dollar.
- The US Dollar weakens as poor US ISM Services PMI dampens the economic outlook.
- Surging global commodity prices strengthen the Australian Dollar.
The AUD/USD pair extends its winning spell for the third trading session on Thursday. The Aussie asset rallies to the round-level resistance of 0.6600 as the US Dollar weakens due to the unexpected decline in the United States Services PMI data for March, reported by the Institute of Supply Management (ISM) on Wednesday.
The US Dollar Index (DXY), which tracks the US Dollar’s value against six major currencies, extends its downside to 104.00. The US ISM reported that the Services PMI missed expectations, dropping to 51.4 from expectations of 52.7 and the former reading of 52.6. Subindexes such as New Orders and Prices Paid also eased sharply, impacting the US economic outlook.
Going forward, investors will focus on the US Nonfarm Payrolls (NFP) data for March, which will be published on Friday. The labor market data will influence market expectations for Fed rate cuts, which are currently expected in the June meeting.
Meanwhile, the Australian Dollar strengthens as global commodity prices witness a sharp upside. Growing expectations for China’s economic recovery due to reviving domestic demand have also boosted demand for the Australian Dollar.
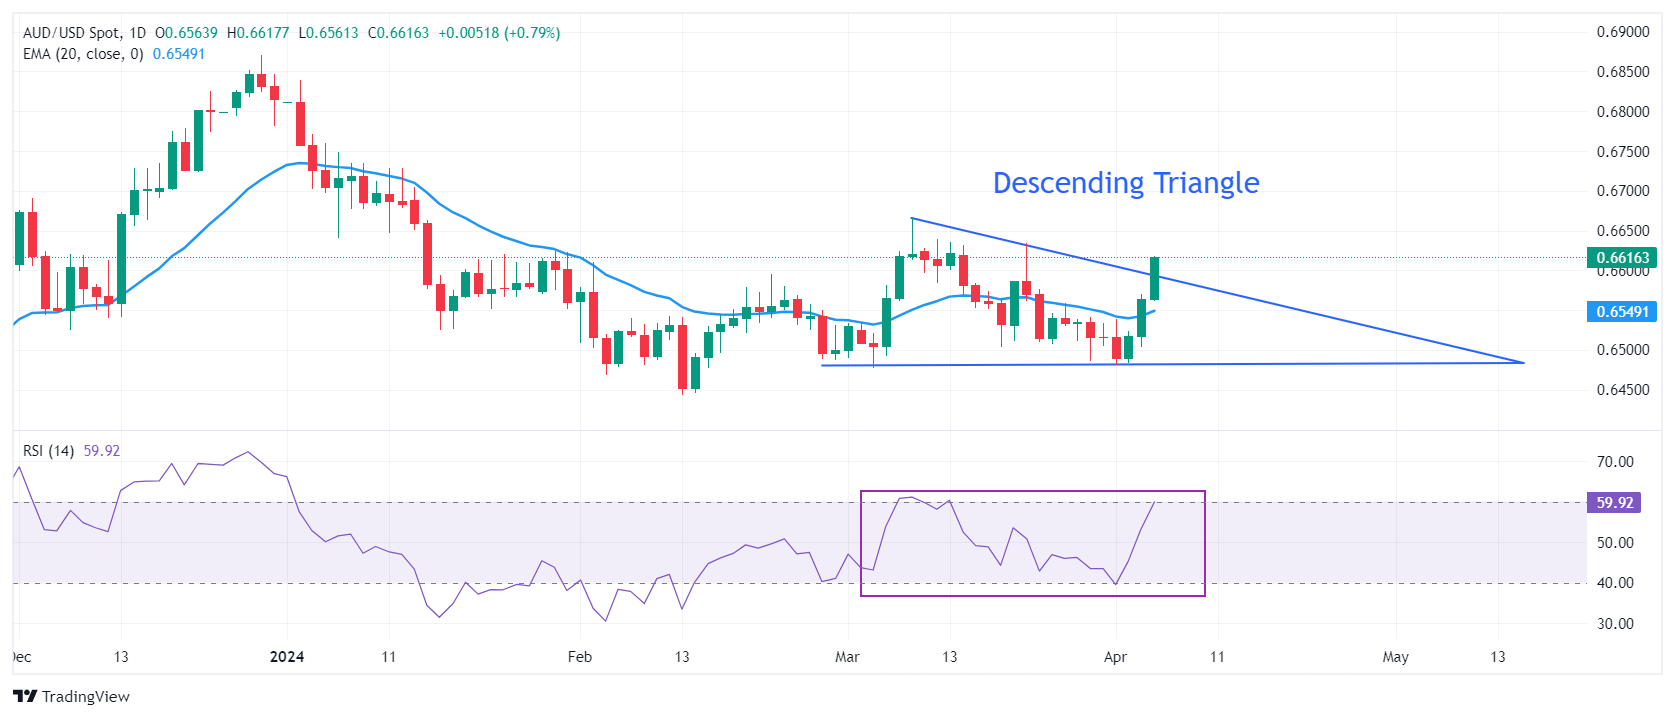
AUD/USD attempts to deliver a breakout of the Descending Triangle chart pattern formed on a daily timeframe. The downward-sloping border of the aforementioned pattern is placed from March 8 high at 0.6667 while horizontal support is plotted from March 5 low at 0.6477. The chart pattern exhibits a sharp volatility contraction and a breakout can happen in any direction.
The Aussie asset sustains above the 20-day Exponential Moving Average (EMA) trading near 0.6550, suggesting upbeat demand for the Australian Dollar.
The 14-period Relative Strength Index (RSI) rebounds to 60.00. A bullish momentum would trigger if the RSI manages to climb above the aforementioned level.
More upside would appear if the asset breaks above March 21 high at 0.6635. This will drive the asset toward March 8 high at 0.6667, followed by the round-level resistance of 0.6700.
On the flip side, investors might build fresh shorts below March 28 low at 0.6485. Profits on shorts would be booked near February 13 low around 0.6440 and the round-level support of 0.6400.
AUD/USD daily chart

Source: https://www.fxstreet.com/news/aud-usd-price-analysis-attempts-descending-triangle-breakout-near-06600-202404041347