Today’s cryptocurrency market is expected to trend downward, according to the Binance Coin price analysis. Despite the price stabilizing yesterday and the bulls closing the day with an advantage, the bears have been able to lower the price to a $320 edge in the past 24 hours. The red candlestick shows that as selling pressure increases, the coin’s worth has fallen once more. Given that the price of BNB/USD has been moving down over the last four hours, the hourly price prediction for this pair confirms comparable market trends.
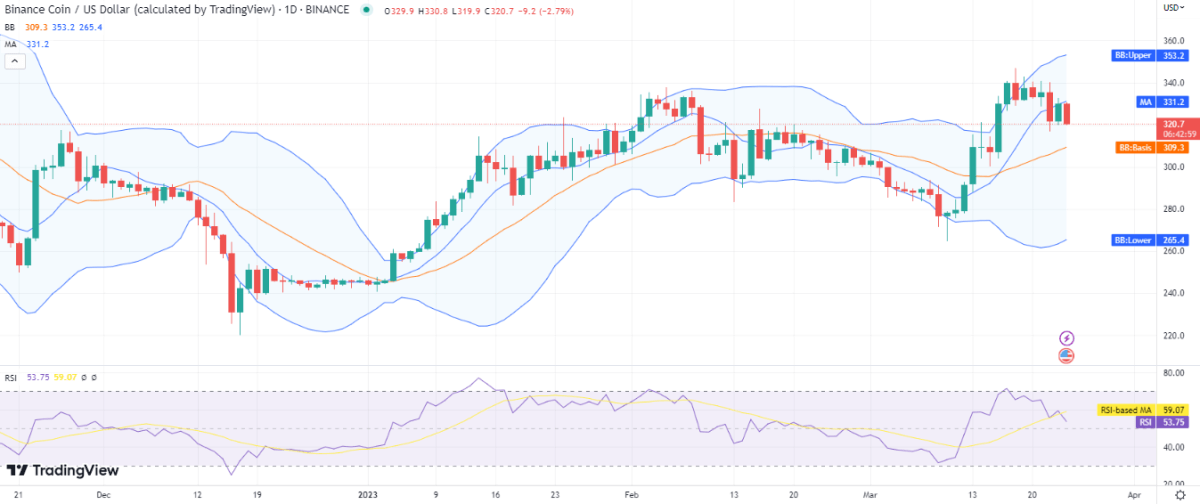
BNB/USD 1-day price chart: BNB decreases to $320
The one-day Binance Coin price analysis reveals a decline in the value of the coin as a result of today’s price correction. Bears have lowered the price, and the coin value is now resting at $320. For the past week, there hasn’t been much change in the price trends; today, the odds were once again in the bears’ favor. The moving average (MA) value is discovered to be $331 as indicated by the one-day price chart.

Price fluctuations will be significant in the coming week because of the comparatively high level of volatility. The upper extreme of the Bollinger bands indicator, which represents the strongest resistance, is at $353, while the lower extreme, which represents the strongest support for the cryptocurrency, is discovered to be resting at $265. As the score has dropped to index 53, a declining curve can be seen on the Relative Strength Index (RSI) graph.
Binance Coin price analysis: Recent developments and further technical indications
Given that the price levels have fallen as a result of the bearish pressure, the hourly price chart for Binance coin price analysis today favors the sellers. Red candlesticks indicate a market decline over the previous 20 hours. Despite early dominance by the bulls, the sellers currently drive market trends. The value of cryptocurrency as of right now is $320. The four-hour price chart’s moving average value is $326, and the SMA 20 curve has been trading below the SMA 50 curve.

The Bollinger bands indicator reads $340 in the upper band and $315 in the lower band; there has been no discernible shift in volatility, according to the indicator. Since the decline has reduced the RSI score to index 39, which indicates market selling activity, the RSI graph displays a downward curve.
Binance Coin price analysis conclusion
The daily and hourly Binance Coin price analysis back the sellers because today’s market value for BNB/USD dropped significantly. The red candlestick indicates a decrease in coin value over the previous twenty hours. As the coin value is currently settling at $320, the buyers’ situation is deteriorating. Although the trend line has changed to point downward, the trend may still reverse in favor of bulls in the upcoming trading session.
Source: https://www.cryptopolitan.com/binance-coin-price-analysis-2023-03-24/