Apecoin price analysis confirms a bearish trend as the market slides down to $4.15. The Apecoin price analysis is currently bearish as it continues its slide down from yesterday’s high of $4.36. The market has found some support at the $4.12 level, but the $4.36 resistance is proving to be a formidable barrier to break.
Apecoin price analysis indicates the market capitalization for the coin has also decreased marginally to reach $12.6 billion, while the 24-hour trading volume stands at $96 million. Cryptocurrency is ranked position 41 on the list of digital assets with the largest market capitalization.
APE/USD 1-day price analysis: Bears mount pressure
The daily chart for Apecoin price analysis reveals that the cryptocurrency has formed a descending wedge pattern. The breakdown of this pattern could see prices testing support at $4.12. A rebound from this level could push prices back up to $4.36, which is the upper limit of the descending wedge pattern.

The Relative Strength Index on the same chart is in bearish territory but is close to the 50 level. This indicates that the prices could consolidate around these levels before a breakout in either direction. The 50-day and 200-day Simple Moving Averages are both sloping horizontally, with the 50-day SMA currently trading above the 200-day SMA. This indicates that there is a possibility for a bullish crossover in the near future. The MACD indicator line (blue) is currently below the signal line, which is a bearish sign.
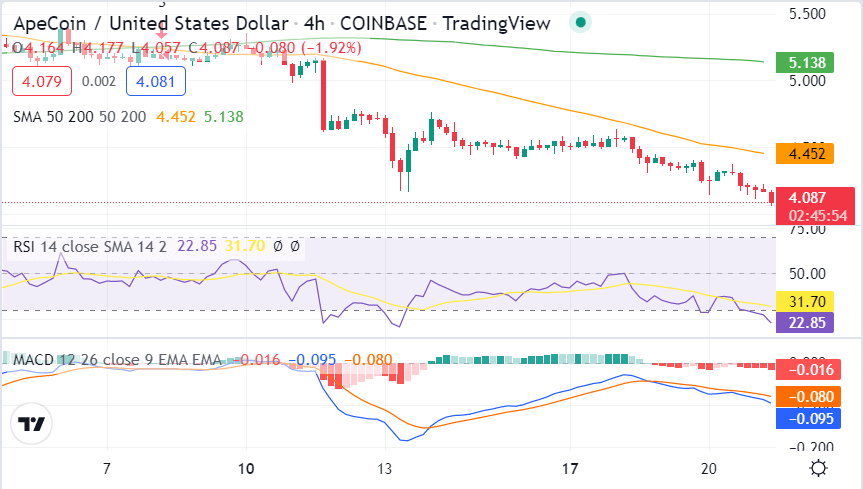
APE/USD 4-hour price chart: Apecoin Price takes backward flight as bears continue to lead
The 4-hour Apecoin price analysis shows that the price is going down again after a brief escape. The bears are pulling down the price levels, and currently, they have reached the $4.15 level. Apecoin price analysis shows that prices have been trading between the $4.12 and $4.36 levels since the beginning of the day’s trading session. The bulls have so far been unsuccessful in pushing prices above the $4.36 resistance level.

The Moving Average Convergence Divergence indicator on the same chart is currently in bearish territory but close to the 0.016 level. This indicates that the market is currently consolidating and a breakout in either direction could occur soon. The RSI indicator is also in the bearish territory with a value of 31.70. The market is currently trading below the 50-day SMA but above the 200-day SMA, which indicates a bearish market bias.
Apecoin price analysis conclusion
Overall, Apecoin prices are bearish in the short term but could see a rebound from the $4.12 support level. A breakout above the $4.36 resistance level is needed for prices to surge higher. The cryptocurrency market has been on a roller coaster ride over the past few weeks with prices surging and then crashing back down. The technical indicators show that the market is currently in a consolidation phase and a breakout is likely to occur soon.
Disclaimer. The information provided is not trading advice. Cryptopolitan.com holds no liability for any investments made based on the information provided on this page. We strongly recommend independent research and/or consultation with a qualified professional before making any investment decisions.
Source: https://www.cryptopolitan.com/apecoin-price-analysis-2022-10-21/