Ethereum (ETH) price analysis hints at potential volatility before it tries to surpass the $4,000 mark again.
Despite being positioned between strong support and resistance levels, ETH may be bracing for a notable correction, potentially around 12.5%, soon.
Ethereum Indicators Foresees Adjustments
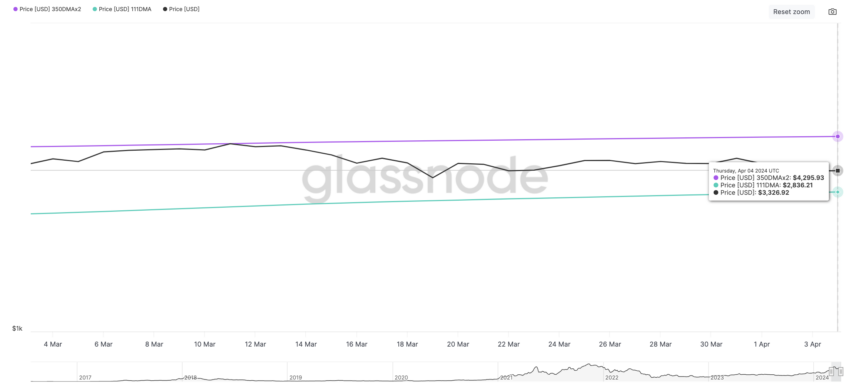
Ethereum’s trajectory, as highlighted by the Pi Cycle Top Indicator, signals possible near-term corrections. This expectation is based on the gap observed between the 111-day moving average and twice the 350-day moving average.
Currently, the indicator sets the upper and lower limits at approximately $4,295 and $2,836, respectively. Although this range could imply market stability, Ethereum’s current standing suggests a downturn might be imminent.
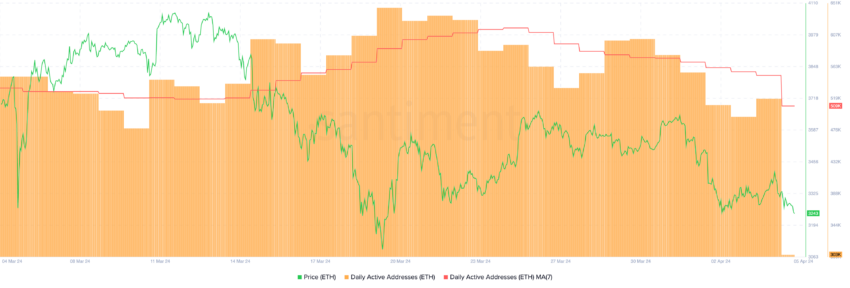
ETH’s daily active addresses have shown a steady decline since March 30, supporting the bearish narrative. This metric is vital as it reflects network activity and user engagement, with a downward trend hinting at decreased usage and interest.
Therefore, it could possibly affect Ethereum’s price negatively due to perceived diminishing demand or fading investor confidence.
ETH Price Prediction: Correction Ahead
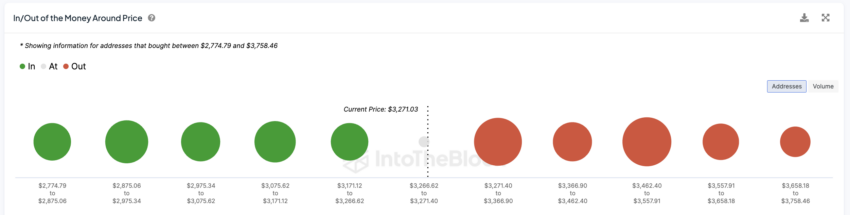
The In/Out of the Money Around Price (IOMAP) chart reveals Ethereum is currently encased by tight support and resistance levels near its present price. This tool offers insight into potential price pressures by highlighting where substantial buying or selling occurred historically.
However, considering the decline in daily active addresses and the Pi Cycle’s forecasts, ETH might soon test its $2,800 support level, indicating a possible 12.5% correction. A failure to maintain this support could see prices fall to around $2,200, underscoring the risk of significant decline.
Read More: Ethereum (ETH) Price Prediction 2024/2025/2030
On the flip side, favorable market dynamics and the introduction of an Ethereum ETF could empower ETH to challenge the Pi Cycle Indicator’s upper boundary, nearing the $4,300 mark.
Disclaimer
All the information contained on our website is published in good faith and for general information purposes only. Any action the reader takes upon the information found on our website is strictly at their own risk.
Source: https://beincrypto.com/eth-price-prediction-correction-soon/