Ethereum was no exception to the crash of the broader cryptocurrency market in the past 24 hours, printing a decrease of around 11% throughout the period. This puts the recently-sparked bullish momentum in question, even though the Merge is estimated to take place tomorrow.
Technical Analysis
By Grizzly
The Daily Chart
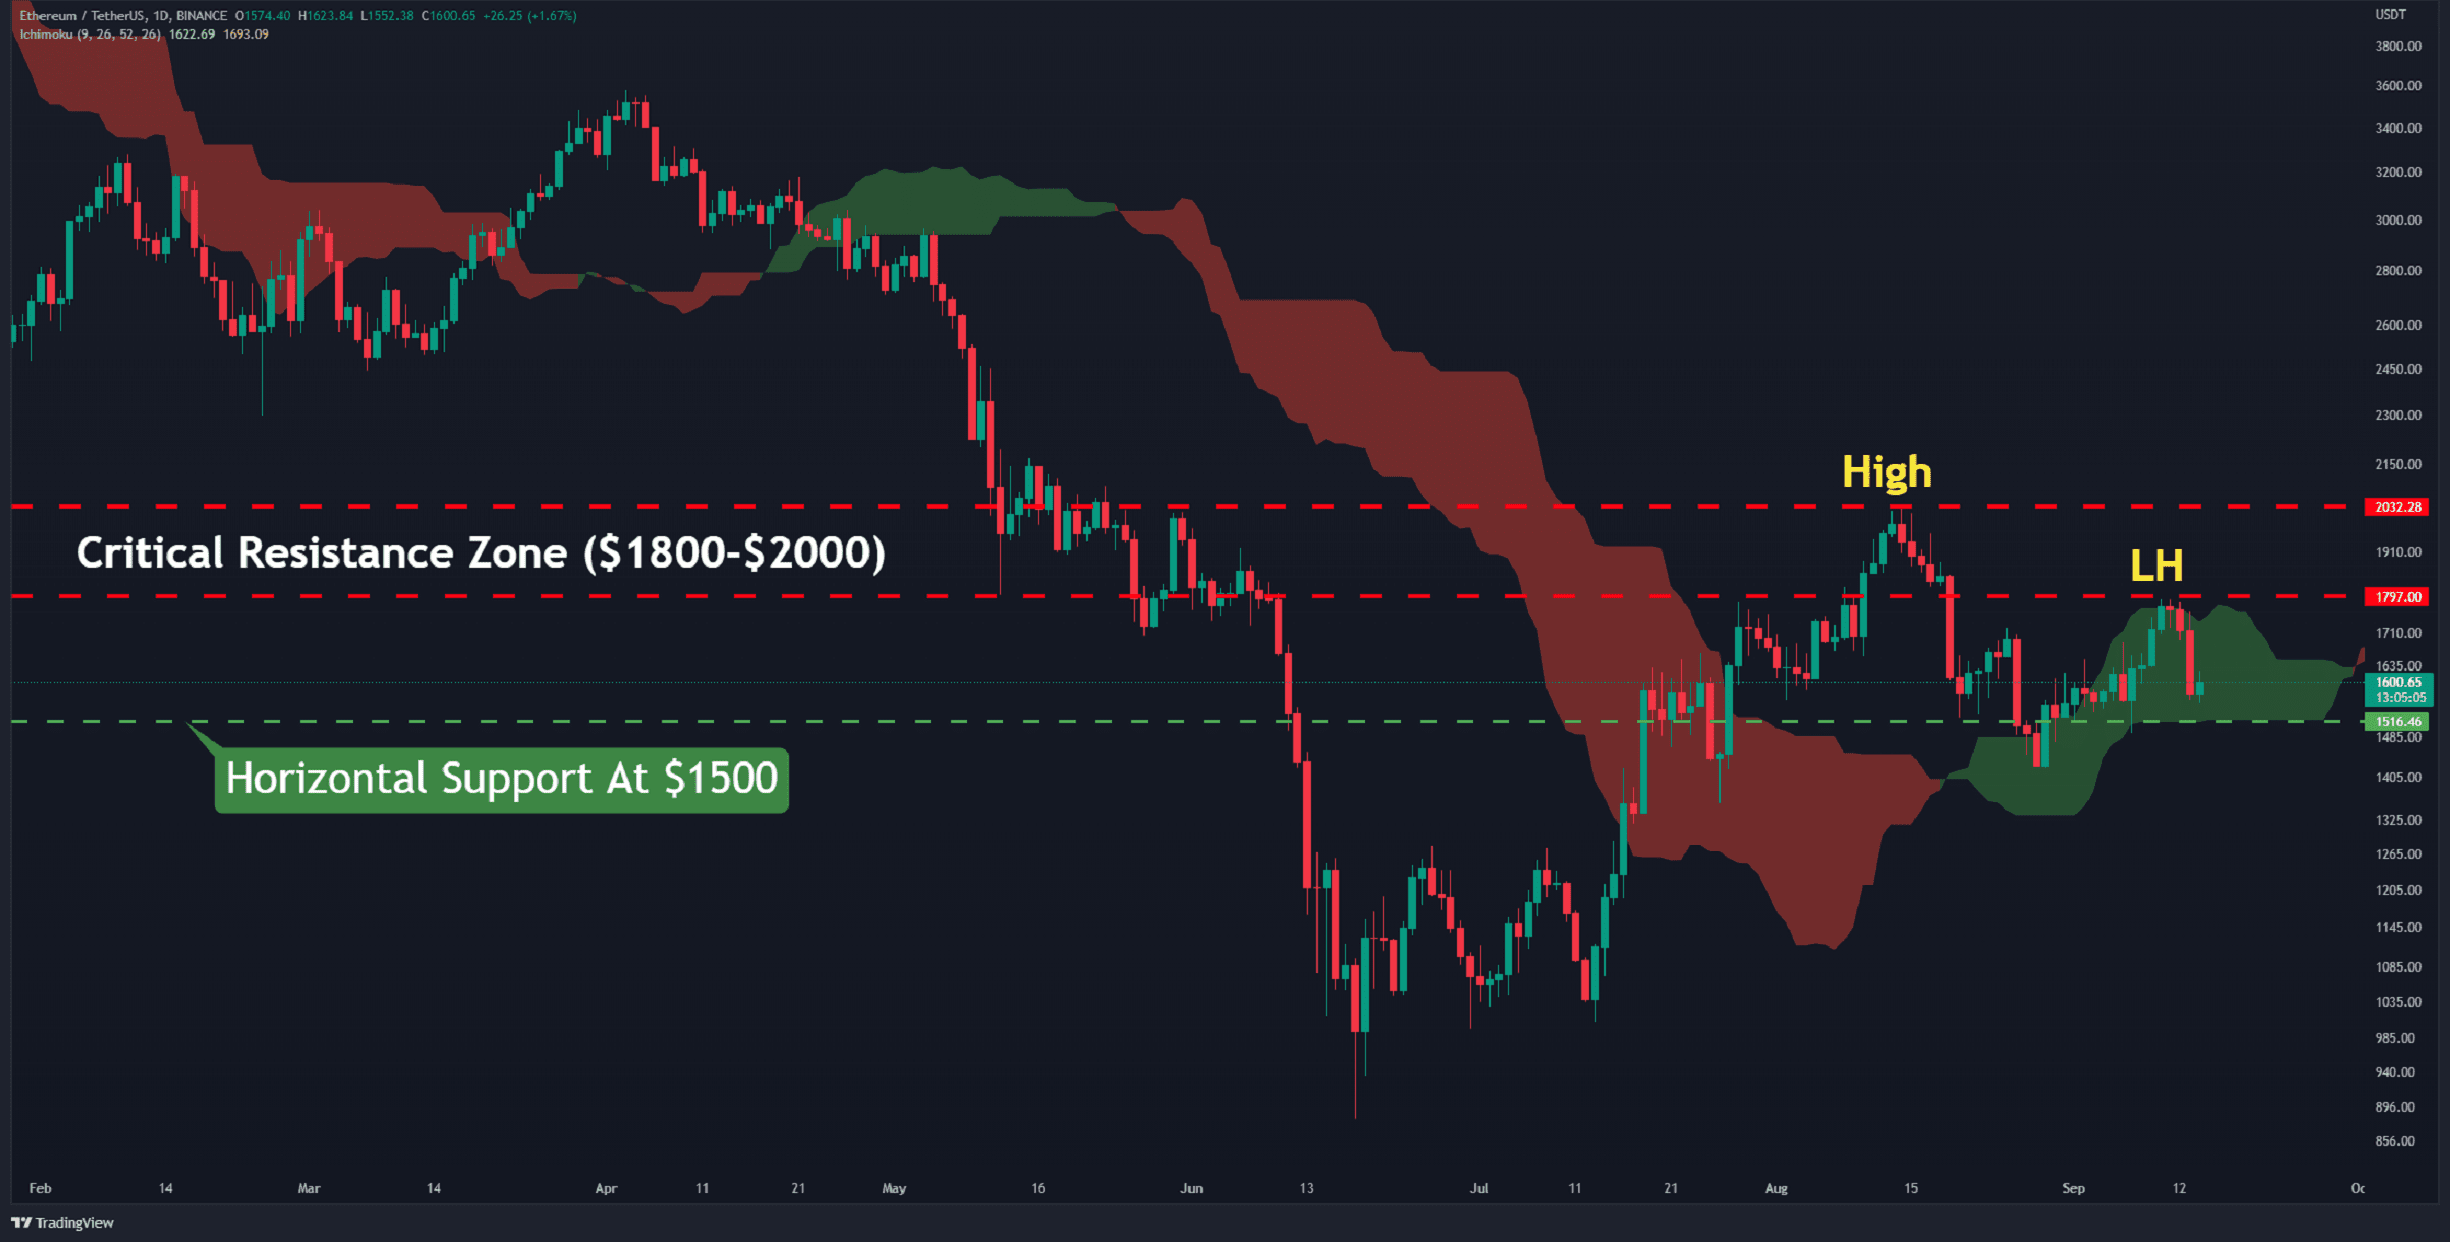
The price was headed towards the overhead resistance area found between $1,800 and $2,000 yesterday. This all changed when the Bureau of Labor Statistics announced the CPI numbers, sending the entire market lower. This marked yet another unsuccessful attempt to push the price above this important zone.
Right now, the Ichimoku cloud top is tangent to the $1,800 level. The volatility levels have also picked up while the price is within the cloud. From a technical perspective, the bottom and the top of the cloud usually represent the support and resistance levels.
The bulls must form a higher high – something they have failed to achieve thus far – if they are to maintain the bullish structure. If they are unable to do so, this would put the entire recent trend in jeopardy. However, it is likely that these efoforts will continue, so long as the price remains above $1,500.
In case investors start booking profits after the Merge, the structure could be rendered meaningless and push the market into bearish territory.
Key Support Levels: $1500 & $1370
Key Resistance Levels: $1650 & $1800
Daily Moving Averages:
MA20: $1597
MA50: $1680
MA100: $1482
MA200: $2072 (200-day MA is approaching the resistance zone)
The ETH/BTC Chart
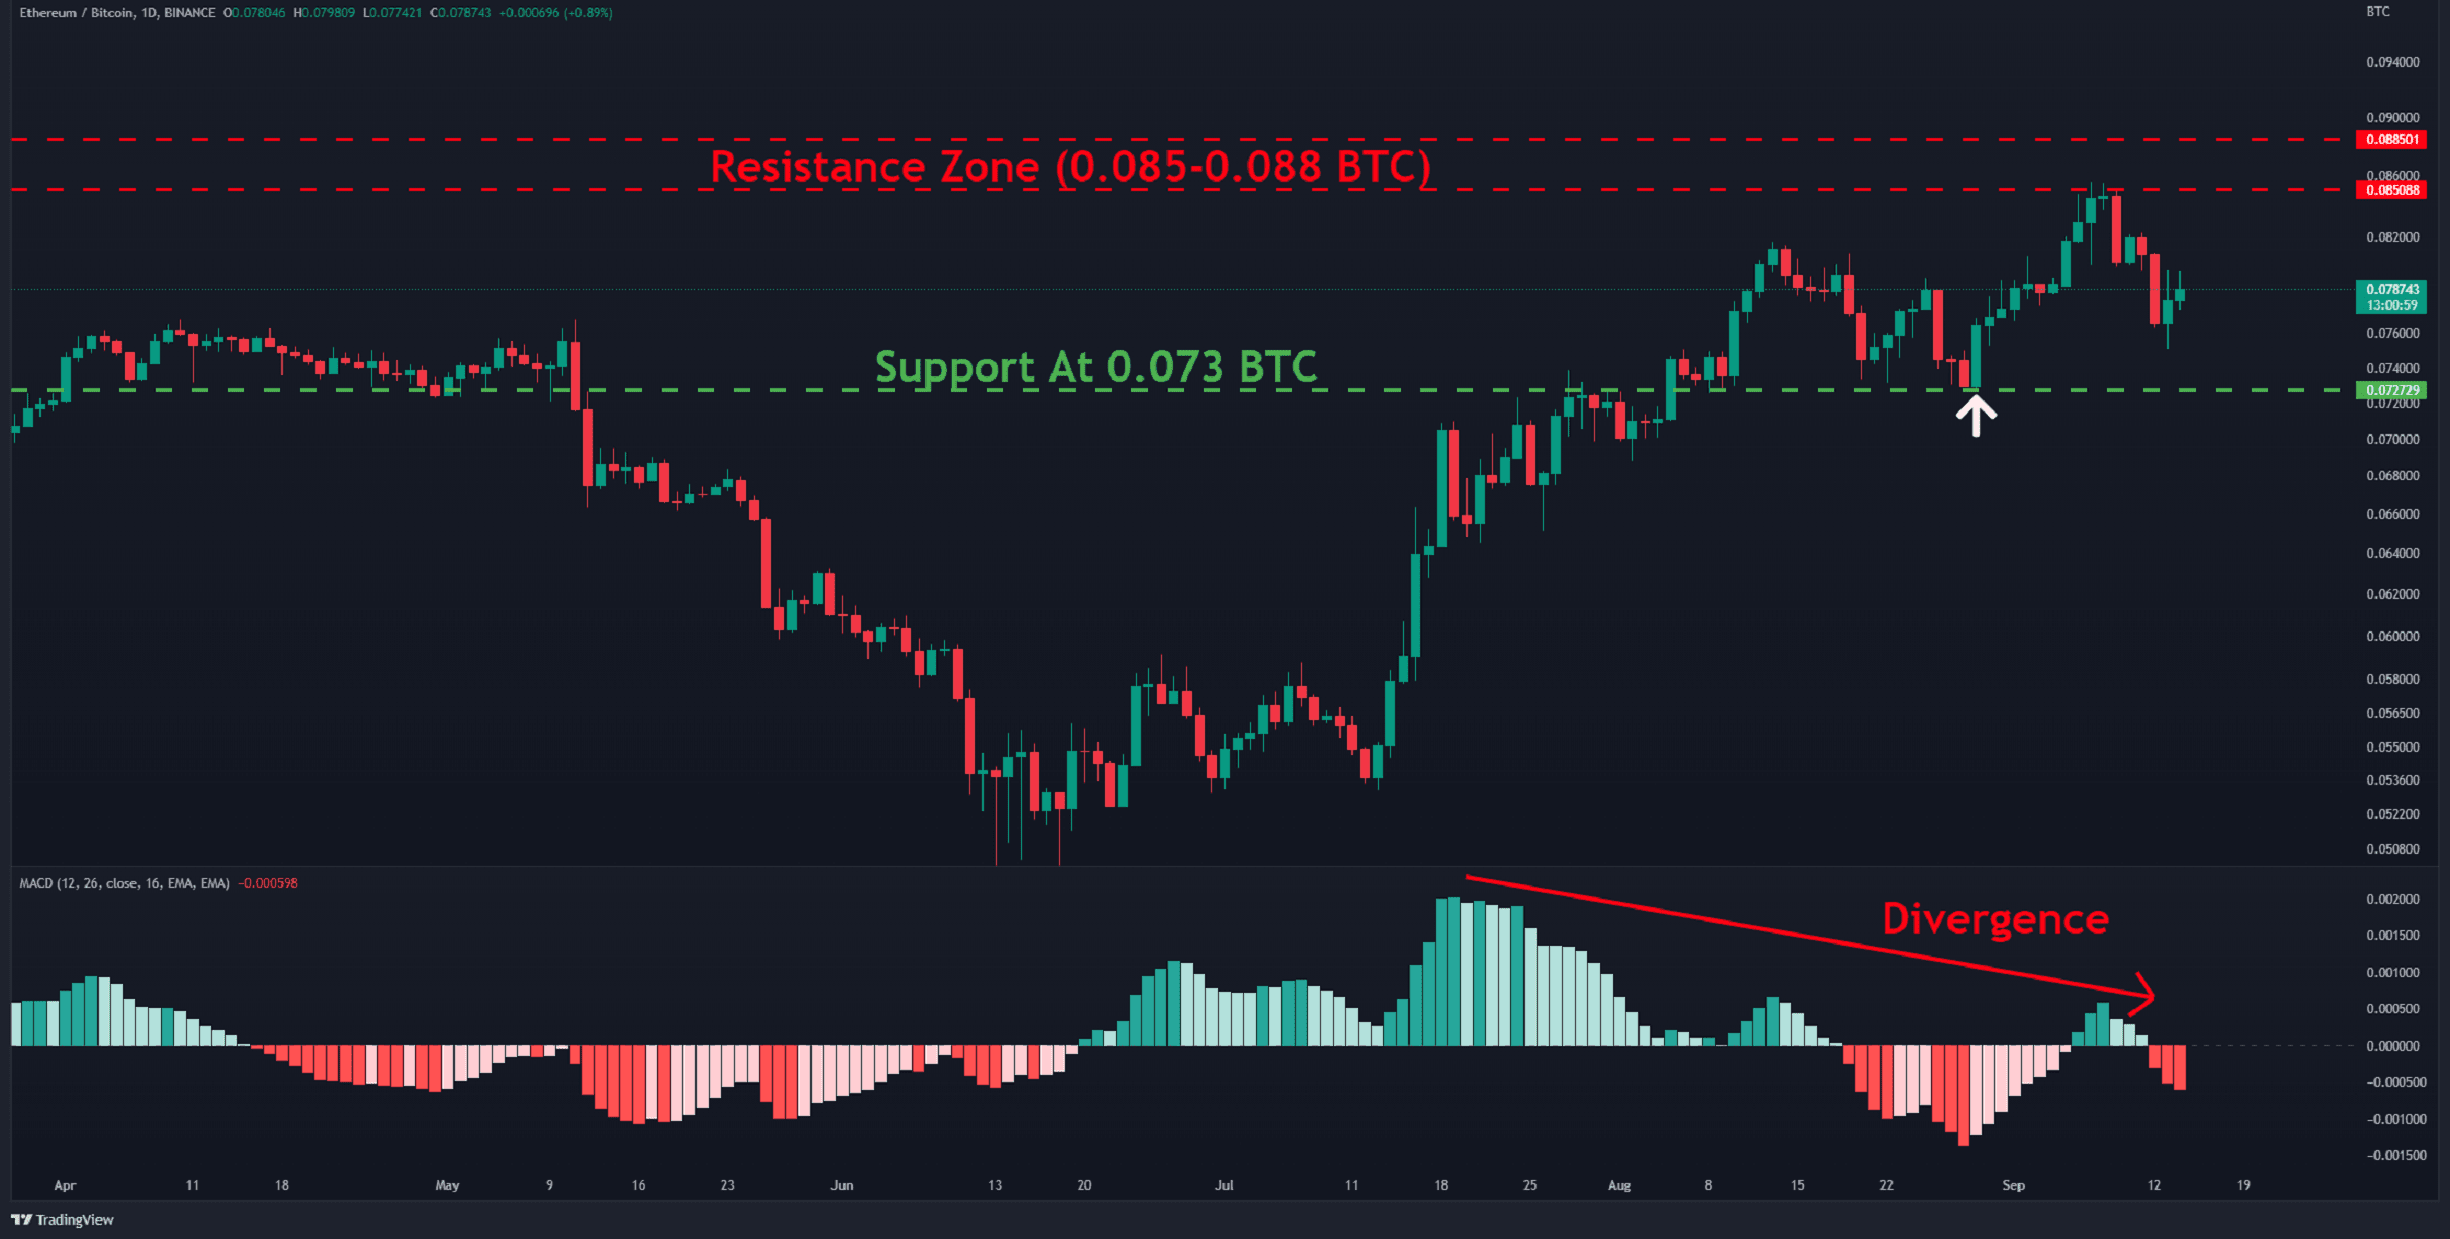
Although the Moving Average Convergence Divergence (MACD) is clearly shifting, the ETH/BTC trading pair chart is considerably bullish. So far, this divergence has resulted in corrections of 11% and 12%.
The first important support to keep an eye on is found at 0.073 BTC (marked in green), and there’s also the potential for the formation of a double bottom pattern.
Retesting the red resistance zone is still an option as long as the price is above this abovementioned support. The trend could change if the pair slips below 0.073 BTC and closes there.
Key Support Levels: 0.0.0.073 & 0.065 BTC
Key Resistance Levels: 0.08 & 0.085 BTC
Binance Free $100 (Exclusive): Use this link to register and receive $100 free and 10% off fees on Binance Futures first month (terms).
PrimeXBT Special Offer: Use this link to register & enter POTATO50 code to receive up to $7,000 on your deposits.
Disclaimer: Information found on CryptoPotato is those of writers quoted. It does not represent the opinions of CryptoPotato on whether to buy, sell, or hold any investments. You are advised to conduct your own research before making any investment decisions. Use provided information at your own risk. See Disclaimer for more information.
Cryptocurrency charts by TradingView.
Source: https://cryptopotato.com/ethereum-price-crashes-to-1-6k-leading-into-the-merge-whats-next-eth-price-analysis/