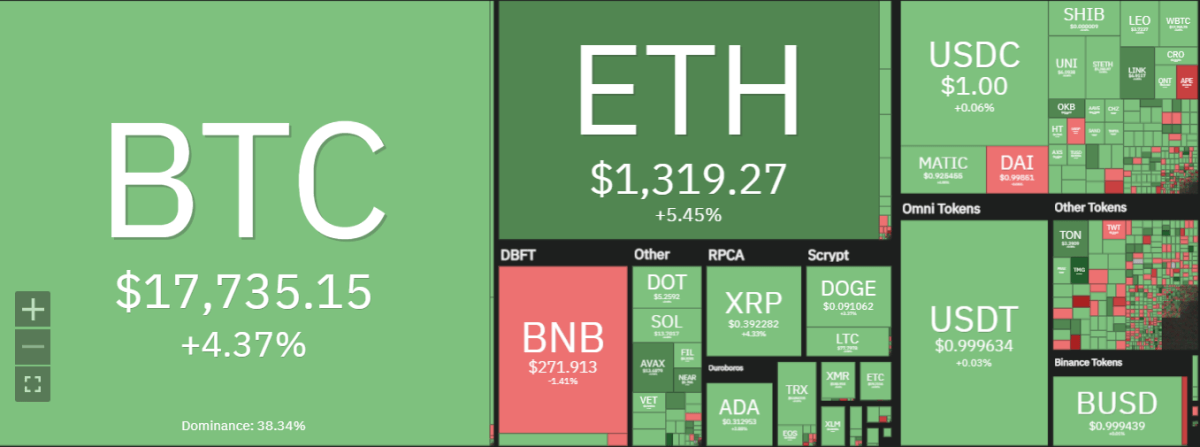
Ethereum price analysis for today shows ETH price has been on an impressive run lately, with the second-leading cryptocurrency trading at around $1,322.66 at the time of writing. Over the past 24 hours, ETH has gained 5.65 percent in the last 24 hours. Ethereum closed yesterday’s trading session at $1,241.45.

The recent breakout above $1,300.0 has been a significant milestone for Ethereum as it is now trading above the previous key resistance level.
The volume of Ethereum has also seen a strong surge in the past 24 hours, increasing by 75 percent. The trading volume is currently at $8,700,336,624 and this is an indication of bullish sentiment in the market.
ETH/USD price analysis on a 4-hour chart: ETH forms a bullish pattern
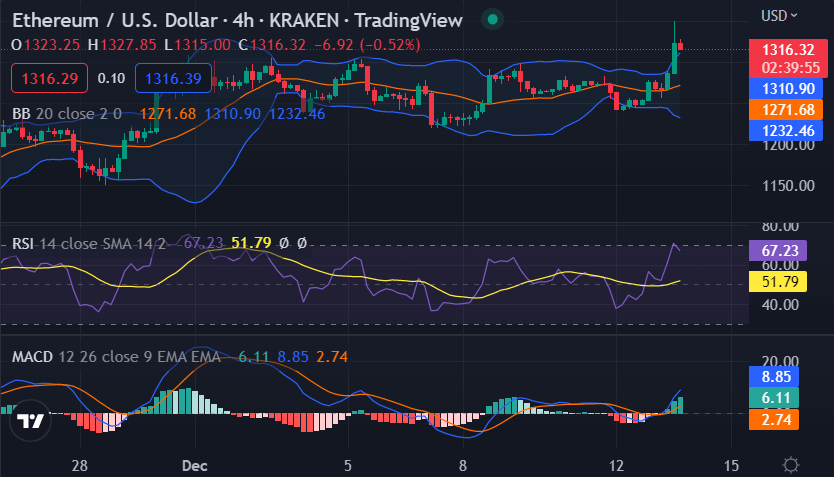
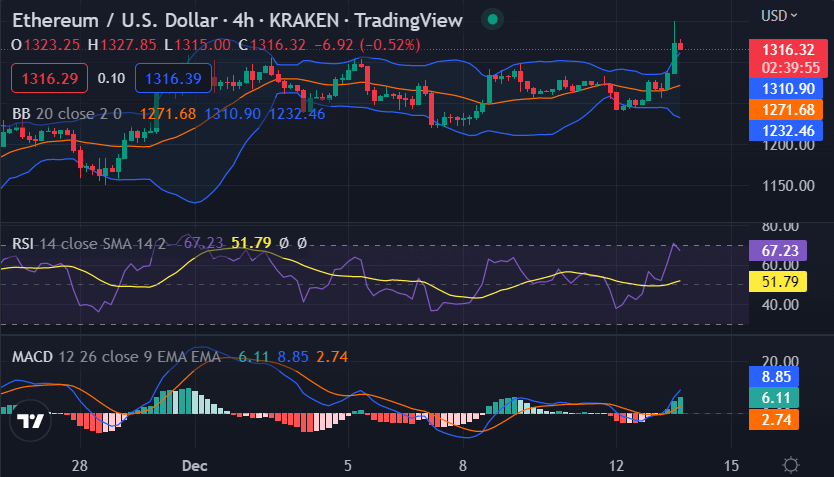
The 4-hour Ethereum price analysis reveals ETH is currently in a strong uptrend with a series of higher highs and higher lows. The price is currently trading above the 50-period Moving Average (MA) and the 20-period MA. The Relative Strength Index (RSI) is trading at a very bullish level of 70.4, indicating that there is still room for further upside in the price before it reaches overbought levels.

The Fib Retracement levels indicate that the ETH/USD pair has strong support at the 38.2 percent level, which is currently at $1,225.0, and resistance at the 50.0 percent level, which is currently at $1,400.0. The next major resistance level is located at the 61.8 percent Fibonacci Retracement level, which is currently at $1,500.0.
ETH/USD 1-day chart analysis: ETH remains firmly in the bulls’ grip
The daily chart of Ethereum price analysis reveals that ETH is trading above all major support levels. The price has broken out from a symmetrical triangle pattern and is currently trading above the 38.2 percent Fibonacci retracement level at $1,310.0. The MACD is printing a bullish crossover and is currently in positive territory. The RSI is trading near overbought levels at 58.

The Stochastic RSI is also in bullish territory and the latest crossover suggests further upside in the price. The next major resistance level to watch out for is $1,500.0.
Ethereum price analysis conclusion
Overall, the Ethereum price analysis suggests that ETH is in a strong uptrend and is likely to continue its impressive performance in the near term. If the bulls can break above $1,500.0, ETH could potentially extend its rally toward the all-time high of $2,047.00.
While waiting for Ethereum to move further, see our Price Predictions on XDC, Cardano, and Curve.
Source: https://www.cryptopolitan.com/ethereum-price-analysis-2022-12-13/
