Ethereum price analysis is indicating a bullish price movement for today after the market trends showed a strong recovery from the recent correction. The current price of Ethereum is hovering around $1,410, however, the bulls are struggling to maintain this level. The selling pressure is gradually increasing as the market tries to break past the $1,410 level. The next key resistance for Ethereum is found at $1,432.
On the downside, Ethereum has plenty of support at $1,378. The current market momentum suggests that the digital asset will remain in a bullish trend, with the potential for a short-term pullback. However, the overall market sentiment is still positive and Ethereum could continue its upwards trajectory in the coming days.
Ethereum price analysis 1-day price chart: Bulls lead the price to the $1,410 mark
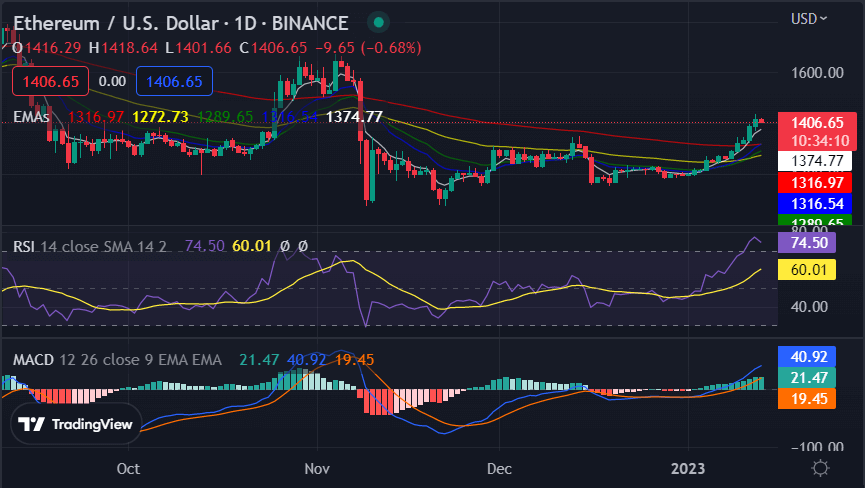
The one-day Ethereum price analysis observed a rise in price because of the ongoing bullish wave. Cryptocurrency overcame the sudden pressure from the bears, and the price levels have improved to $1,410 today gaining more than 0.89 percent value during the last 24 hours. It is expected they will achieve a new high above the first resistance level present at $1,432 if the bullish momentum continues. The coin also reports a massive gain of 13.35 percent in value over the past week, which shows bullish dominance.

Looking at the technical indicators, the EMA-9 and EMA-20 curves are positioned above the price candles, indicating a bullish trend in the market. The RSI has also managed to stay in the overbought zone, which is a sign of strong market momentum. The overall Ethereum price analysis suggests that the digital asset is heading in the right direction and is likely to reach new highs in the near future. The Moving average convergences/divergence (MACD) indicator presents increasing positive momentum, which suggests that the buyers are likely to dominate in the market.
Ethereum price analysis: Recent developments and further technical indications
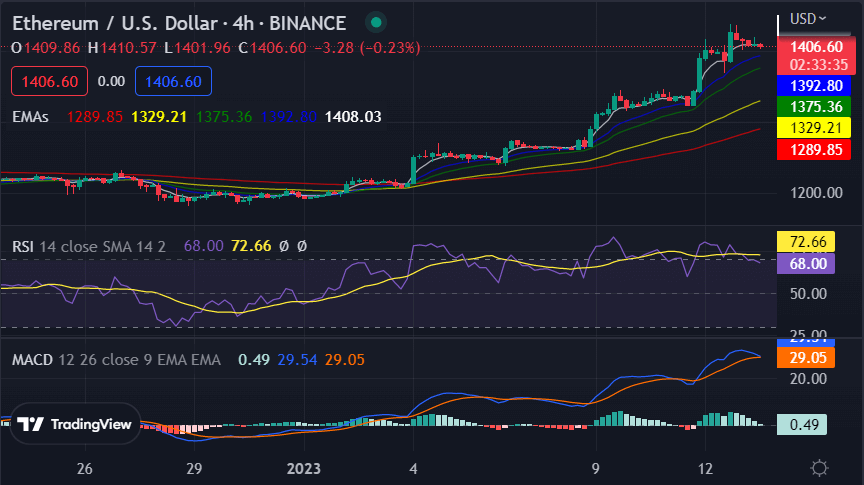
The 4-hour Ethereum price analysis shows a progression of green candlesticks which shows a continuous rise in price levels for the last 24 hours. Previously there has been a constant bearish wave dominating the price action, today, the trend is in favor of buyers. The ascending triangle pattern observed in the chart also confirms that buyers are dominating the market.

Looking at the technical indicators, the MACD line has crossed above the signal line and is moving upside which shows bullish momentum in the market. The RSI score has increased up to index 72.66 due to the ongoing bullish trend. The Exponential Moving Average-9 and EMA-20 are positioned above the price candles, which confirms a bullish trend in the market.
Overall Ethereum price analysis
The overall Ethereum price analysis suggests that the digital asset is likely to reach new highs in the near future. The market is currently dominated by buyers, and the bulls are likely to remain in control for some time. The technical indicators also present bullish momentum, and the support level of $1,378 is likely to provide more buying power if the Ethereum price goes below this level.
While waiting for Ethereum to move further, see our articles on how to buy Litecoin, Filecoin, and Polkadot.
Source: https://www.cryptopolitan.com/ethereum-price-analysis-2023-01-13/
