Disclaimer: The information presented does not constitute financial, investment, trading, or other types of advice and is solely the writer’s opinion.
- Ethereum has a bullish outlook, and a buying opportunity could present itself on a lower timeframe market structure break.
- The CVD was not encouraging, but other technical aspects and price action supported further upside.
Ethereum benefited massively from the rally of the past few weeks. The altcoin king has managed to break past the range established in November. It consolidated for a few days above the $1500 mark.
Read Ethereum’s Price Prediction 2023-24
At the time of writing, the $1600 level served as support. Another dip could offer a buying opportunity. Further upside remained likely for Ethereum, and the $1700 and $2000 levels are ones to watch out for.
The $1680 saw a minor reaction, but dips would be for buying
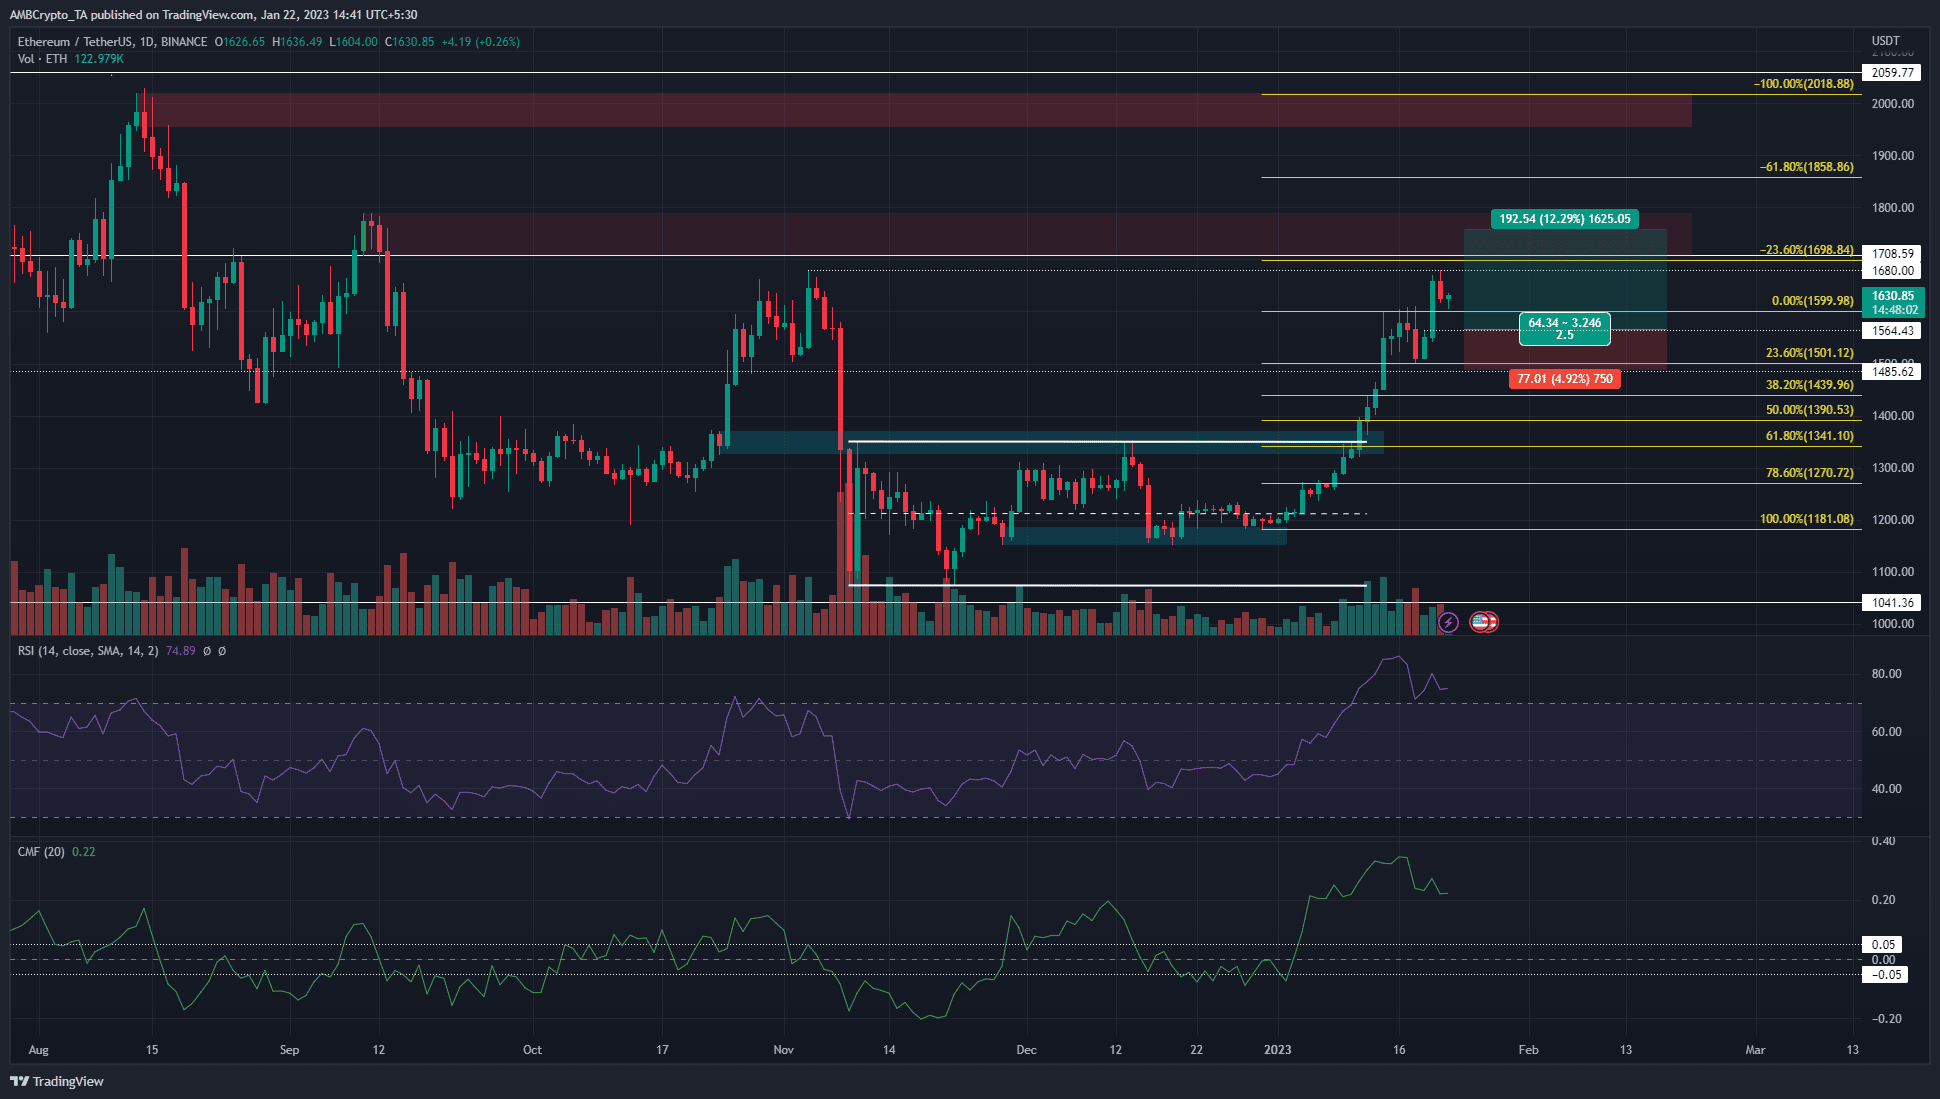
Source: ETH/USDT on TradingView
The previous move up to $1680 in early November was followed by a wave of violent selling. This highlighted the importance of the $1630-$1680 area on the chart. In particular, a session close above $1680 can be taken as a signal that a bullish continuation was likely.
To the south, there was an imbalance on the charts from $1564-$1617. The lower timeframe charts showed bearish near-term momentum as well, with the daily timeframe RSI forming a bearish divergence, although the momentum was still firmly in favor of the bulls. The CMF stood at +0.22, which indicated significant capital flow into the market.
Is your portfolio green? Check the Ethereum Profit Calculator
They do not signal a trend reversal but indicated a pullback to $1617 or $1564 was possible. A further dip was also a possibility. Hence, traders can look to buy a retest of the $1564 level, targeting the bearish order block at 1700 as a take-profit area. The Fibonacci extension levels (yellow) had confluence with the two important bearish order blocks higher up the price chart.
A daily session close below $1485 will invalidate the bullish idea laid out.
Open Interest stalled momentarily but has risen impressively over the past week
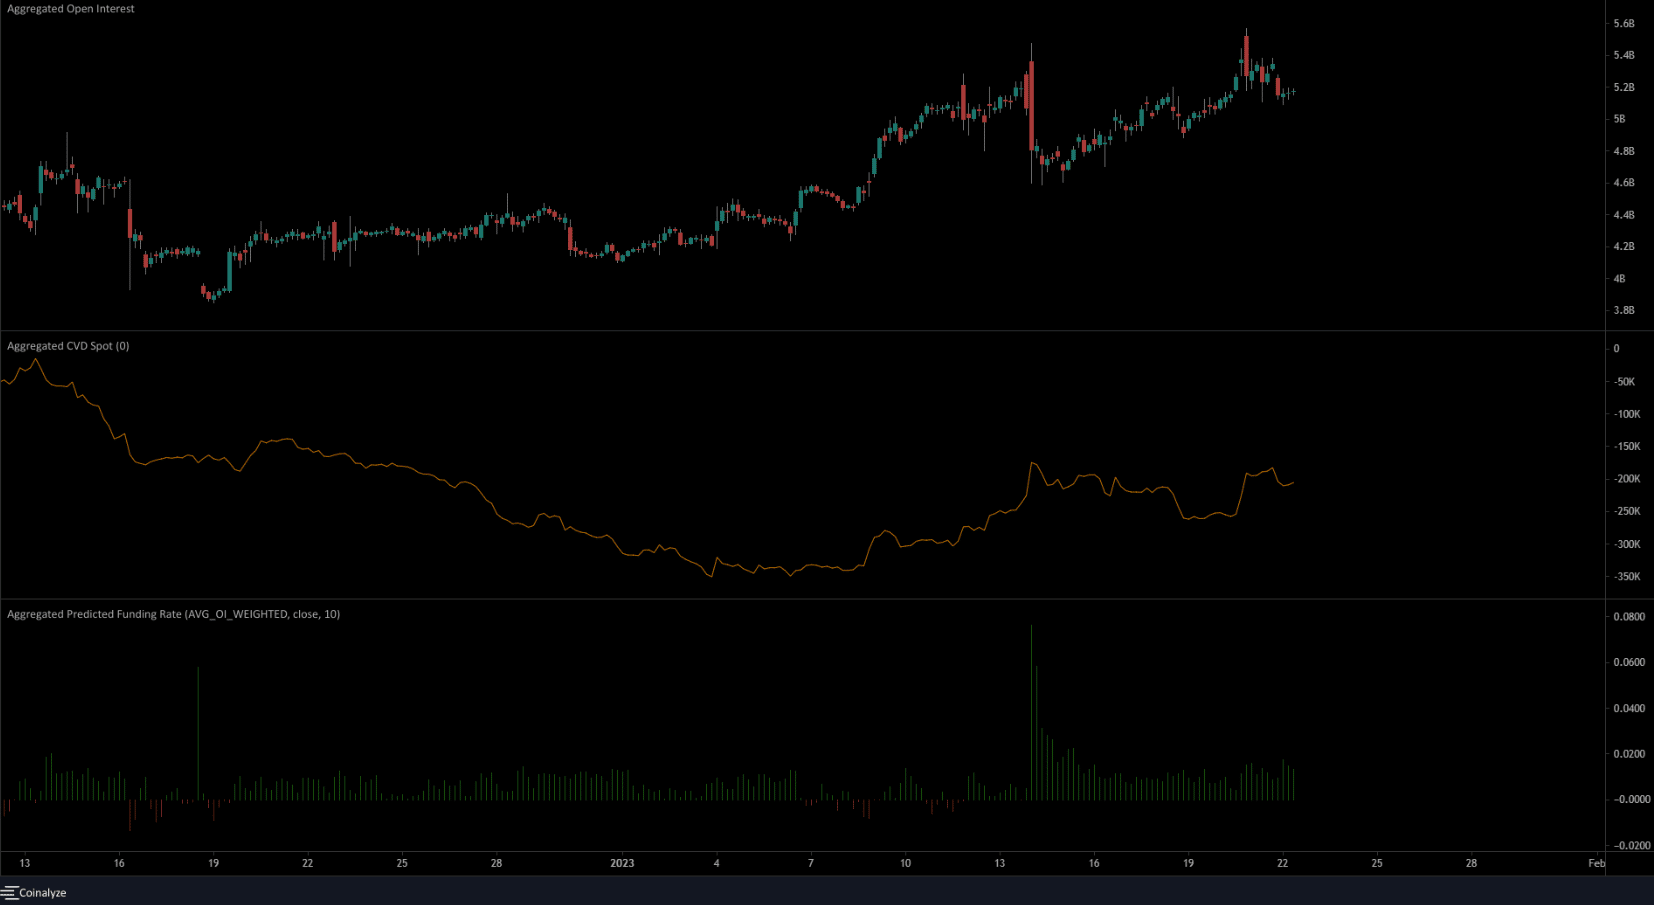
Source: Coinalyze
From January 14, both the price and the Open Interest have made significant gains. This showed strong bullish sentiment in the market. The spot CVD also made steady gains throughout January, to highlight consistent buying pressure. Yet, it has reverted to a flatter profile over the past week. If this changes, it will be another indication of bullishness.
The predicted funding rate weighted by Open Interest across exchanges was positive as well.
Source: https://ambcrypto.com/ethereum-notes-a-strong-bullish-bias-on-charts-heres-why-1680-is-critical/