- Ethereum trading volume decreased by 16% in the last 24 hours.
- The ETH price approaches oversold territory on the daily chart.
Ethereum bears appear to be showing exhaustion following an extended period of dominance. Over the past three days, the ETH chart has displayed an upward trajectory, marking a recovery from the 12% dip experienced over the past month. Also, it has managed to bounce back from its lowest point in five months, when it briefly touched $1,538. Moreover, it is currently trading at $1,634, fluctuating from $1,613 to $1,640.
One of the factors contributing to this temporary respite from the bearish trend is the Bitcoin and Ethereum ETFs saga which continues to generate momentum. On top of it, following the footsteps of big giants like Blackrock, ARK Investors, and more, Franklin Templeton filed for spot Bitcoin ETFs two days ago.
Analysts suggest that these financial giants are deemed to have a strong chance of gaining regulatory approval due to the stringent surveillance measures they have put in place to prevent market manipulation. The potential approval of these ETFs could undoubtedly have a substantial impact on the entire cryptocurrency market.
On the other hand, the Ethereum network recorded 1,089,893 unique wallets engaged in ETH transactions on Wednesday, marking the second-highest number in the asset’s almost eight-year history.
Santiment, a prominent crypto data aggregator, suggests that this unexpected surge in activity might serve as the necessary signal for prices to stage a rebound. Additionally, Ethereum’s Number of Active Addresses (7-day MA) recently reached a three-month high of 30,545.637.
However, investors appear to remain cautious in the face of bearish sentiment, as evidenced by a 16.08% decline in trading volume over the past 24 hours. Moreover, Ethereum is still 66.62% away from its all-time high, which was reached two years ago.
Can Bulls Drive Price Further?
An analysis of Ethereum’s recent price movements reveals an intense battle between bulls and bears on the daily chart. The 9-day exponential moving average (EMA) currently stands at $1,629, above the current trading price, signaling ongoing bearish sentiment. The daily relative strength index (RSI) sits at 44, indicating that the asset is nearing oversold territory.
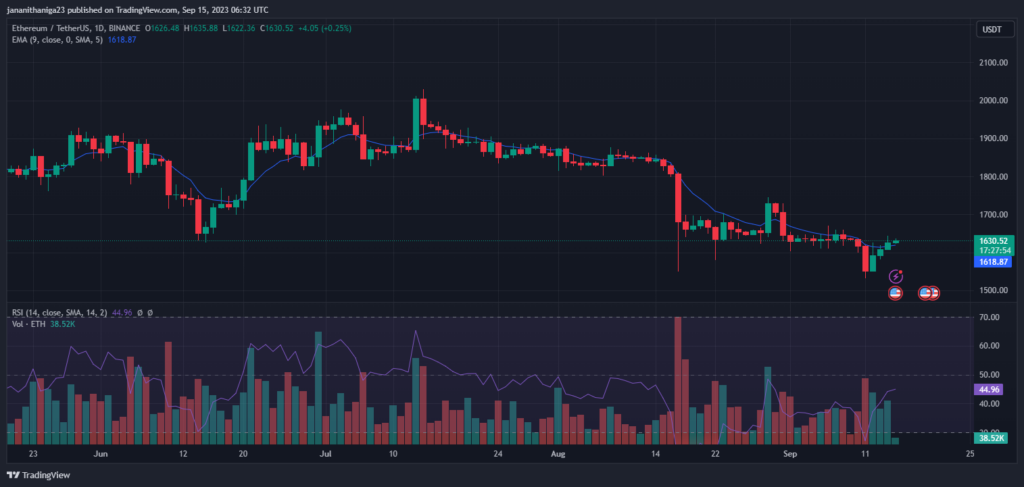
For the bulls to secure victory, they will need to drive the price above the 20-day EMA and subsequently attempt a rally towards the 50-day simple moving average (SMA) at $1,762. Such a move could increase the likelihood of Ethereum trading within a range spanning from $1,626 to $2,000 in the foreseeable future.
Source: https://thenewscrypto.com/ethereum-eth-price-recovery-hints-at-bearish-exhaustion/