- ETH took support at yearly demand zone of $1000 and attempting to sustain above 50 day ema
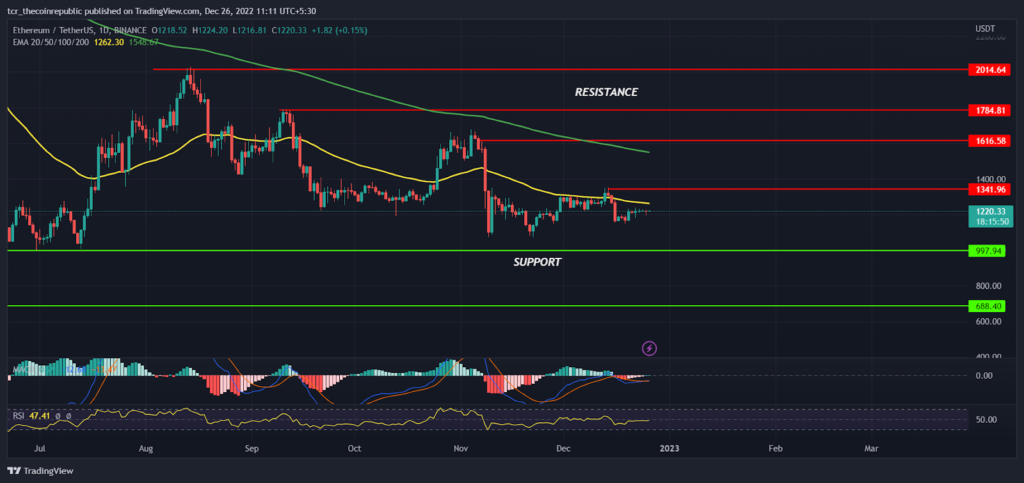
- The MACD had generated positive crossover whereas the RSI at 47 denotes balance between bullish and bearish positions.
Ethereum Price is trading with mild bullish cues while forming Doji candles near the $1200 levels indicates indecisiveness, while the bulls were attempting to reclaim above its short term resistance at the 50 day ema line, which may further decide the direction of ETH prices. As of now, ETH/USDT is trading at $1219 with the intraday gains of 0.10% and 24 hour volume to market ratio stood at 0.0276
Bullish trend reversal in ETH soon ?

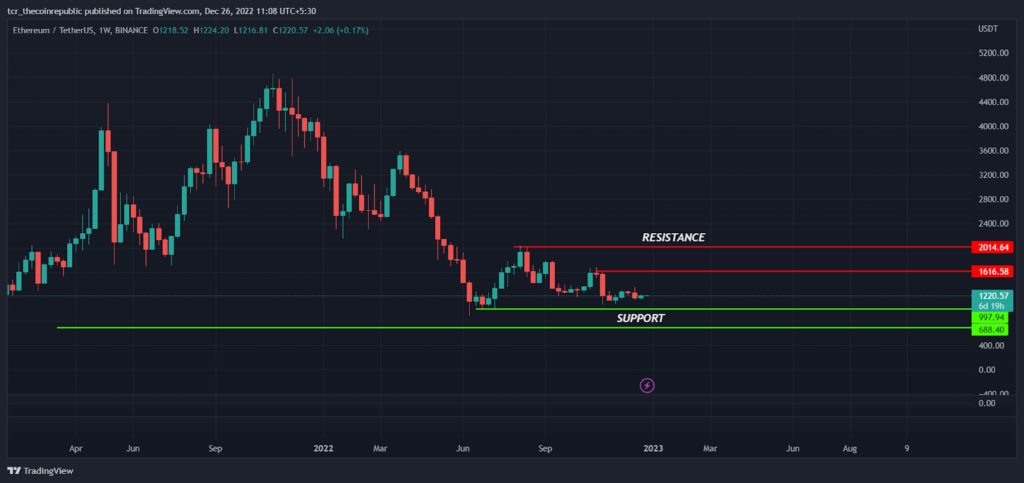
On a weekly time frame, ETH Price is forming a head and shoulder pattern with lower low swings indicates bears dominance on the higher levels. In the mid of June 2022 ETH prices hit a yearly low at $881 and found some stability in lower levels which will act as a demand zone in coming months. After a little bit of consolidation in the range between $1000 to 1100 ETH bulls succeeded to breakout on the higher side while forming higher high candle formation and hit a high at $2030 but unfortunately bulls were unable to sustain the higher levels and lost all its previous gains.
ETH undervalued at $1200 levels ?

On a daily time frame, ETH prices look quite stable and have been consolidating in the wide range between $1000 and $2000 with the mild bearish bias. In the mid of July 2022 prices gained some positive momentum and were able to reclaim 50 day ema (yellow) which triggered more upside momentum and take the price towards $2000. Later, the investors found ETH overvalued at $2000 levels and kept on selling from the higher levels. As of now, prices were trading nearby its important support zones and likely to see expansion on either side soon However, if ETH price slipped below $1000 we may see further downside towards $800 and below levels.
The 200 day ema(green) sloping down indicates a trend to remain weak on a positional basis and the 50 day ema (yellow) at $1262 will act as an immediate hurdle in coming weeks followed by next will be $1341 and $1616. The MACD had generated a fresh positive crossover indicating prices may witness some upside movement in coming days whereas the RSI at 47 denotes balance between the strength of bullish and bearish positions.
Summary
Ethereum Price had not been able to perform well in the past couple of months and had been continuously dominated by bears but as we move forward to the new year we may see major developments in the Ethereum blockchain and its network which will likely impact the ETH prices positively. As per technical analysis, ETH price is undervalued at current levels and may attract the investors attention soon.
Technical levels
Resistance levels : $1341 and $1616
Support levels : $997 and $800
Disclaimer
The views and opinions stated by the author, or any people named in this article, are for informational ideas only, and they do not establish financial, investment, or other advice. Investing in or trading crypto assets comes with a risk of financial loss.
Source: https://www.thecoinrepublic.com/2022/12/31/ethereum-eth-price-prediction-will-the-eth-investors-meet-2000-in-2023/