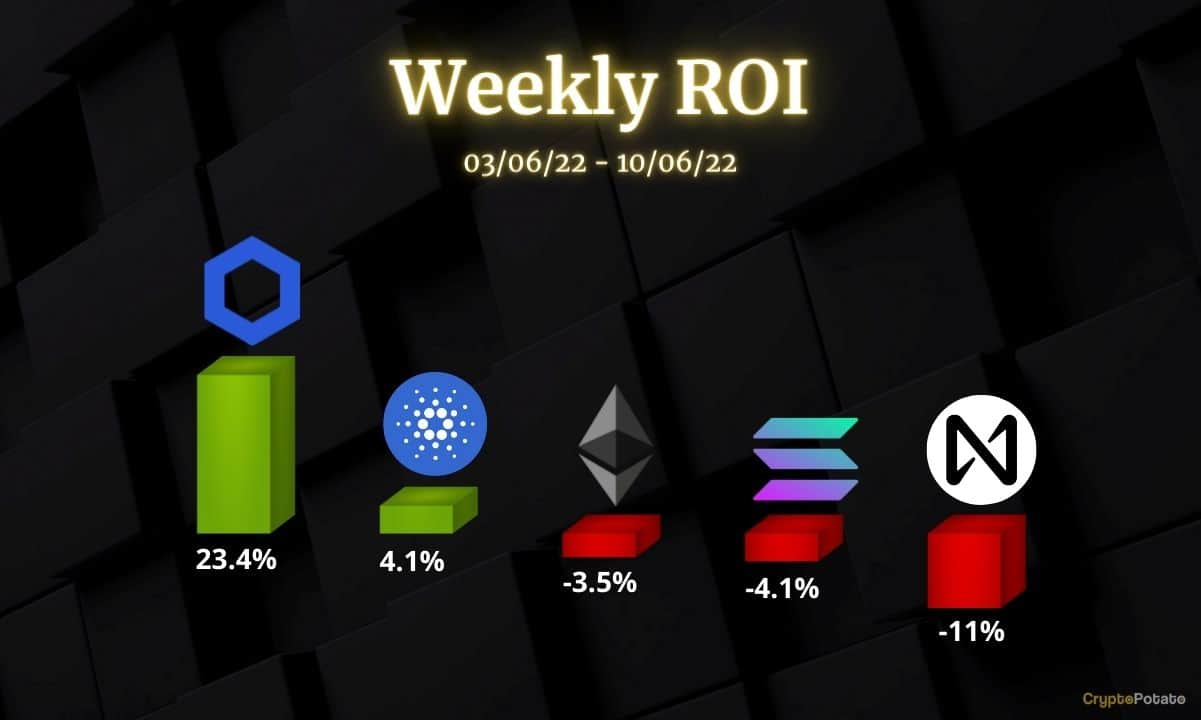
This week, we take a closer look at Ethereum, Cardano, Solana, Chainlink, and NEAR Protocol.
Ethereum (ETH)
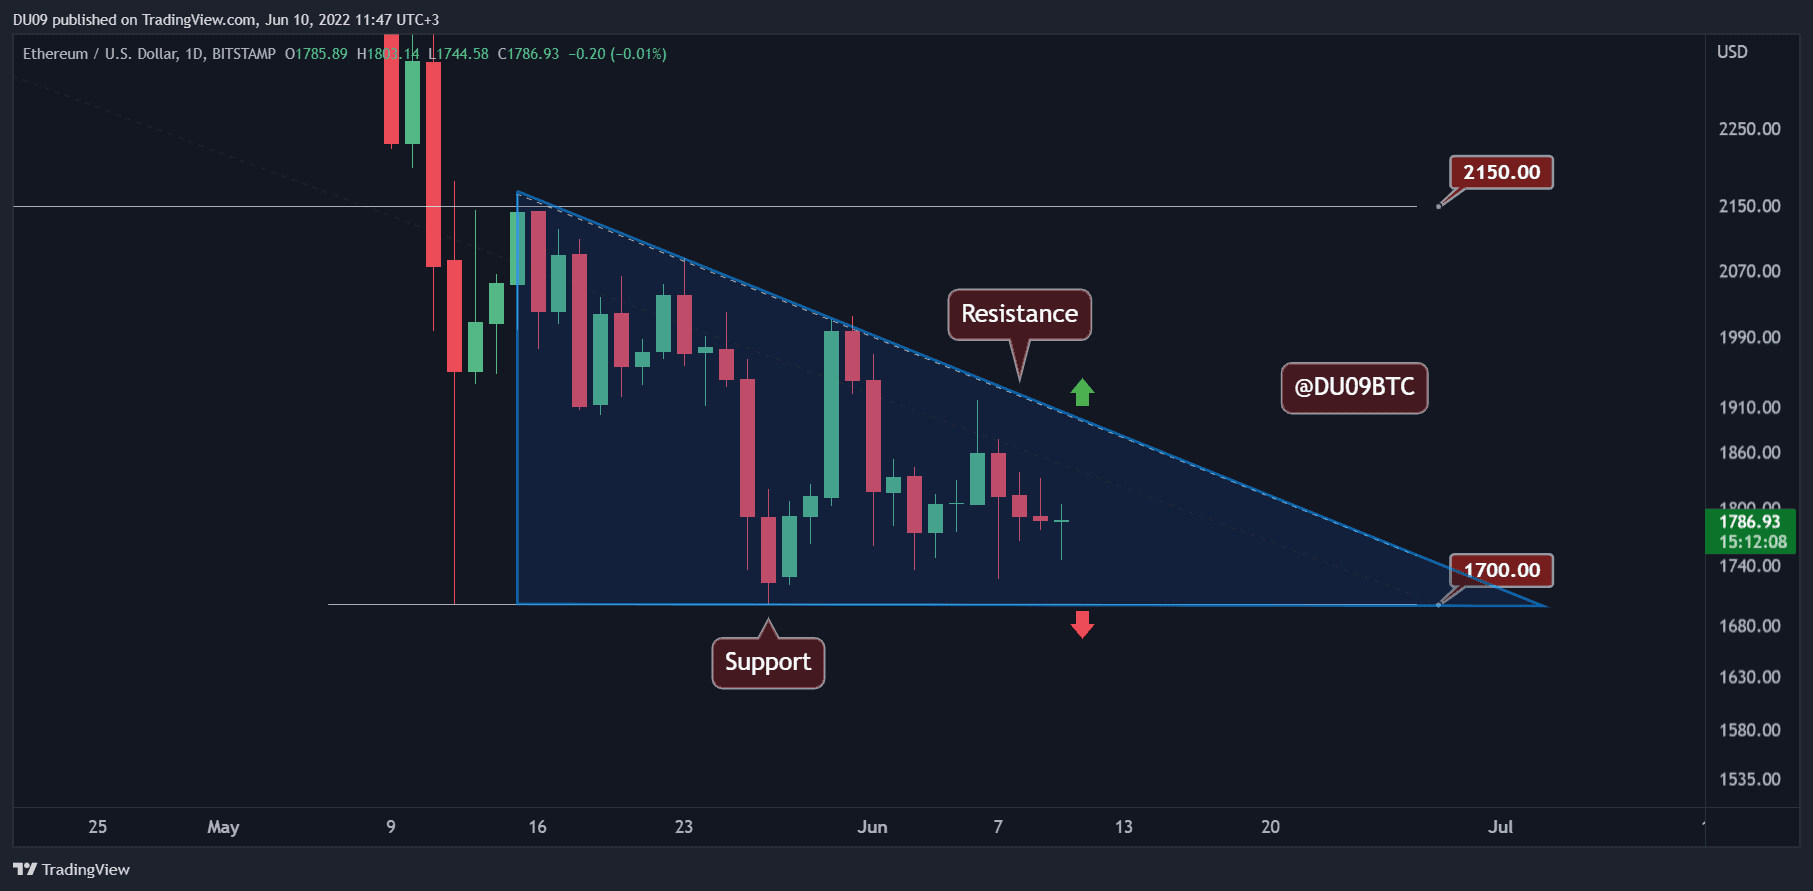
Ethereum had an uneventful week, with the price being almost flat the whole time. ETH closed the past seven days with a minor 3.5% loss. The descending triangle (represented in blue on the below chart) remains intact, and the cryptocurrency made no attempts to break away. The market has been moving sideways and shows a lot of indecisiveness.
The current support is found at $1,700, and ETH has not tested this level since May 27th. The key resistance is at $1,900, and a break above it would likely lead to a relief rally. Until then, the best we can hope for is for the price to move inside the triangle.
Looking ahead, Ethereum will soon approach the apex of this formation, and the price will have to make a decision one way or another. The indicators are also giving out mixed signals.
Cardano (ADA)
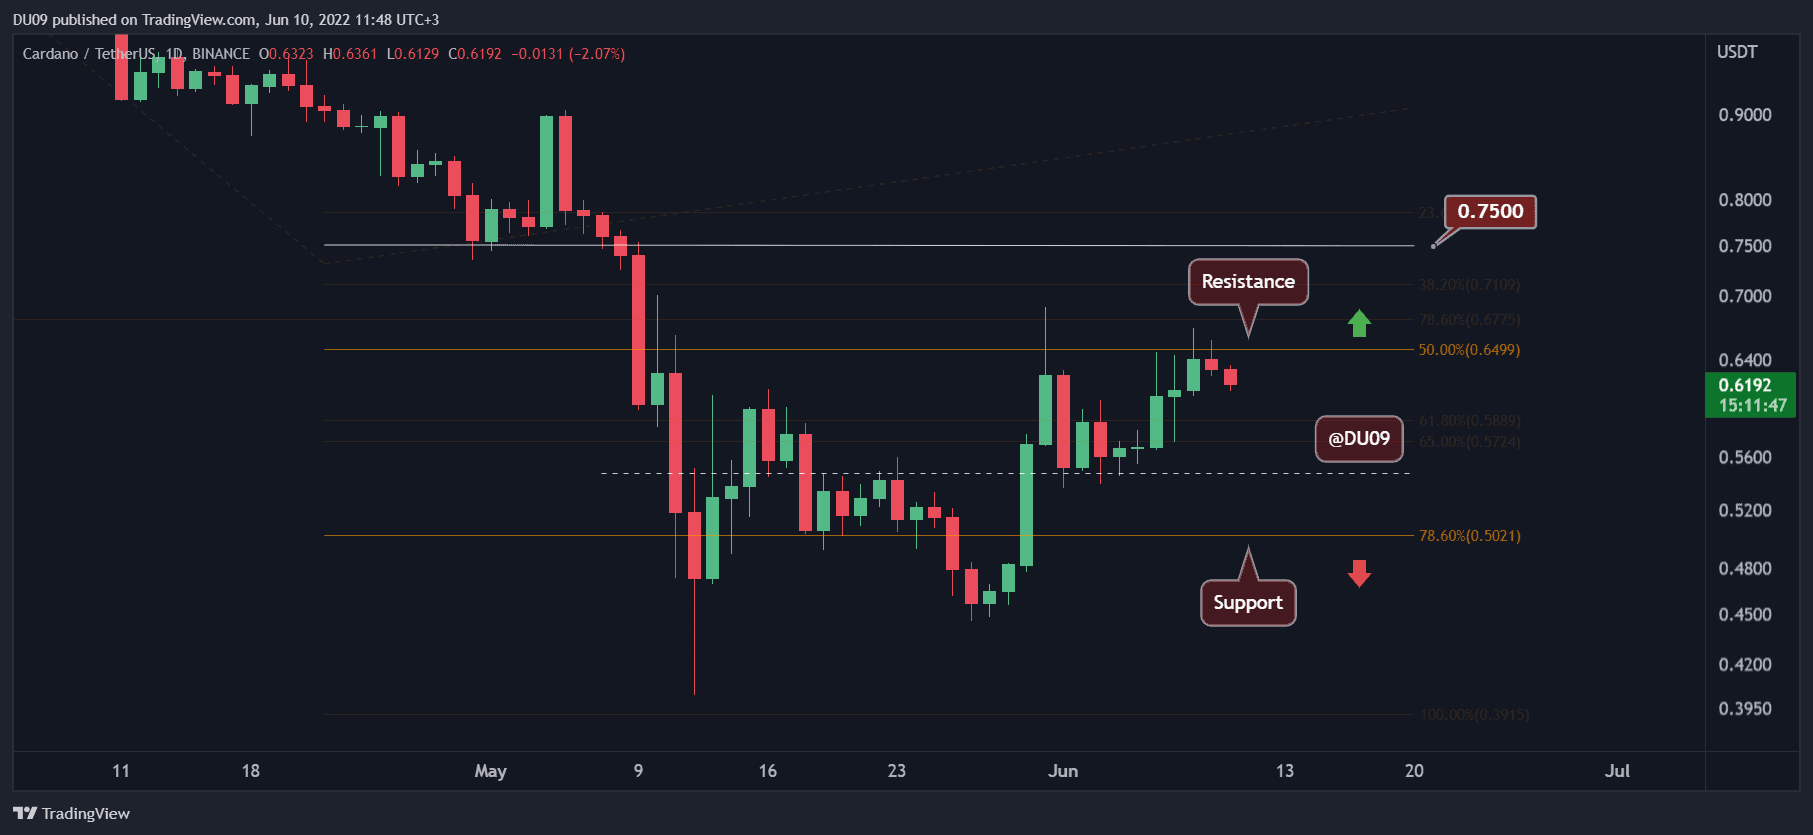
ADA performed well in the past seven days, registering a 4% increase at the time of this post. But after a significant rally, the price action is giving signs that a correction is ahead. Since the cryptocurrency was rejected a second time at the key resistance of $0.65, a pullback seems like the more probable scenario.
The key support levels are found at $0.55 and $0.50. The last time ADA tested $0.55, it used that level as a pivot for another push higher. It is important for the cryptocurrency to not lose this level if the bullish momentum is to be maintained on the larger timeframes.
Looking ahead, it seems likely that we will see ADA enter into a short correction. Once there, the bulls may start building up momentum so that the next time they test the key resistance they can break away and turn it into support.
Solana (SOL)
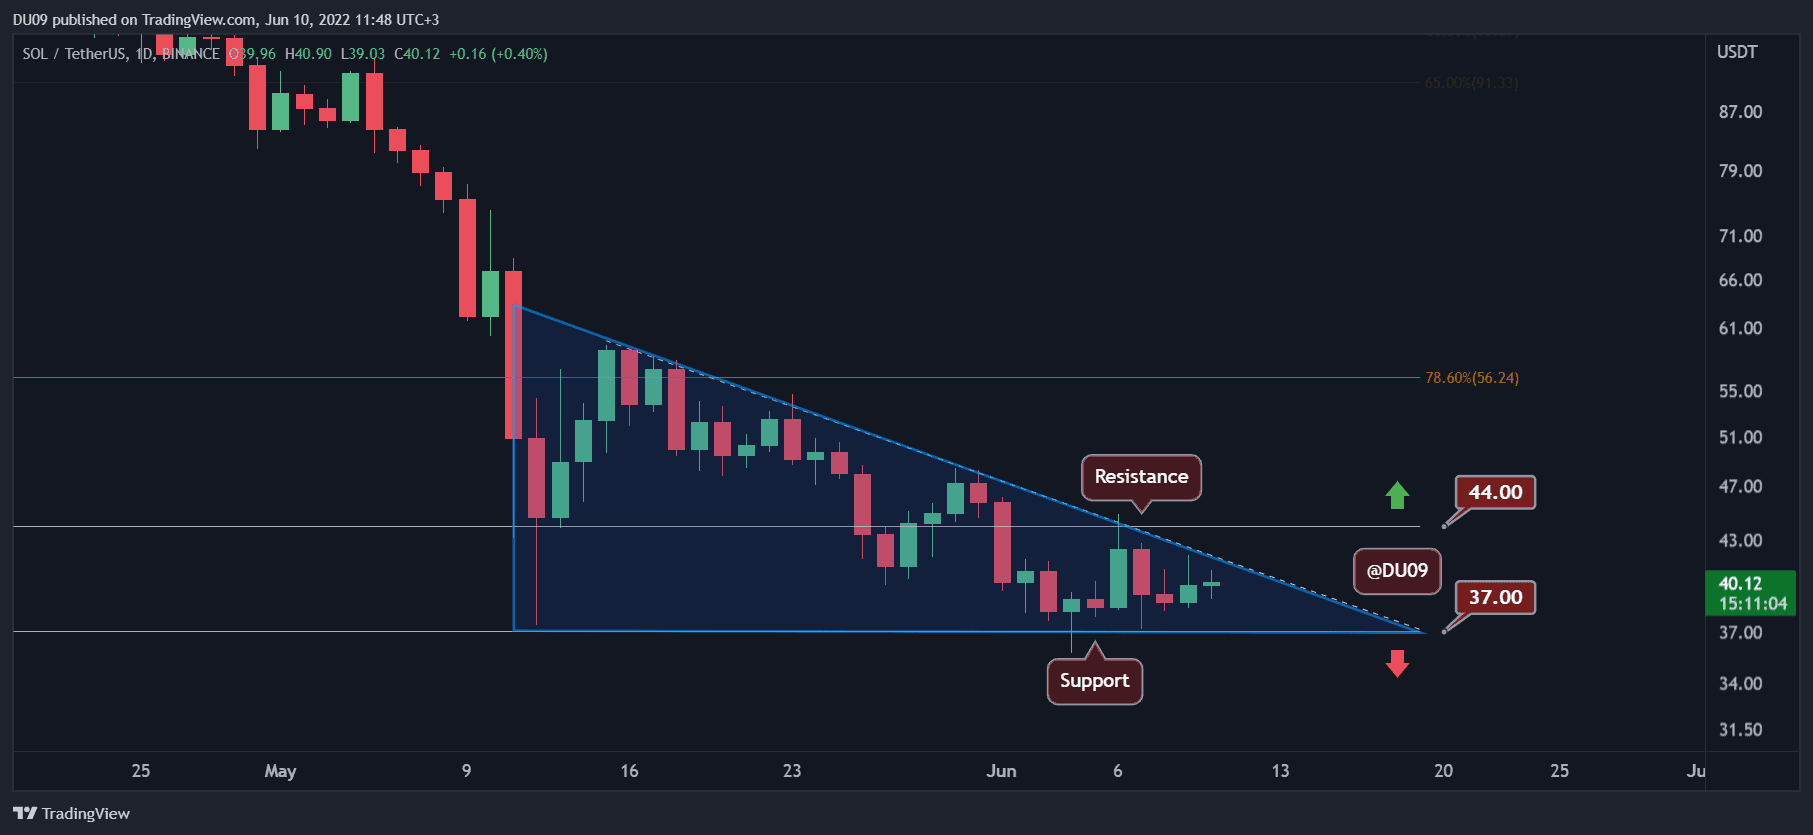
Despite being stuck into a descending triangle, Solana is giving some signs of hope that it could break above this formation. This consolidation also led to a low volatility period, with price only registering a 4.1% loss compared to seven days ago.
If Solana can manage to break above this triangle, then it could rally to $44 and above. The daily MACD is bullish, and the RSI is making higher highs and higher lows. While this is encouraging, SOL still has to attempt a breakout to bring buyers back.
The key support is found at $37, and Solana has to do its best to protect this level in the future, even if an attempt at a breakout fails. Losing this key level would take SOL into a much deeper correction.
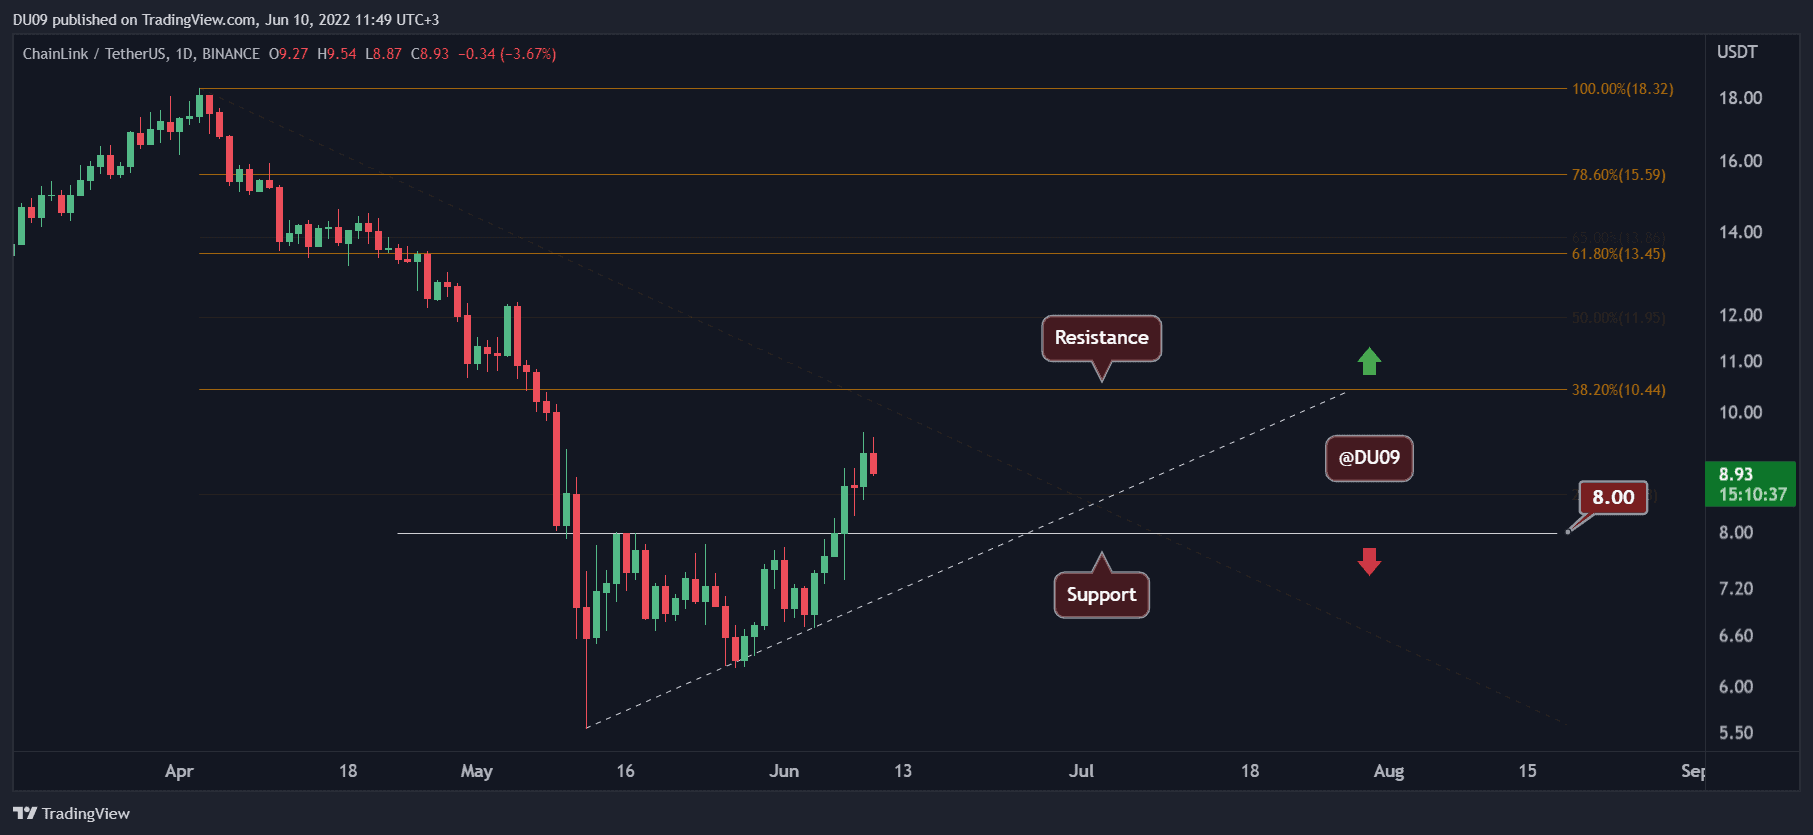
Chainlink (LINK)
The best performer on our list this week, Chainlink, managed to rally by 23.4% in the past seven days. LINK did not top only our list, but basically most of the market in the same period. In the process, the price broke the key resistance at $8, which was quickly turned into support.
The rally had strong momentum, but as LINK approached $10, selling intensified, and now the price seems to lack the push needed to break above this critical level. For this reason, it seems likely for the price to retest the critical support before another try.
Looking ahead, LINK has a good chance to maintain this bullish momentum, particularly if the price does not fall under $8. The indicators on the daily timeframe remain bullish, and they have not reached overbought conditions yet.
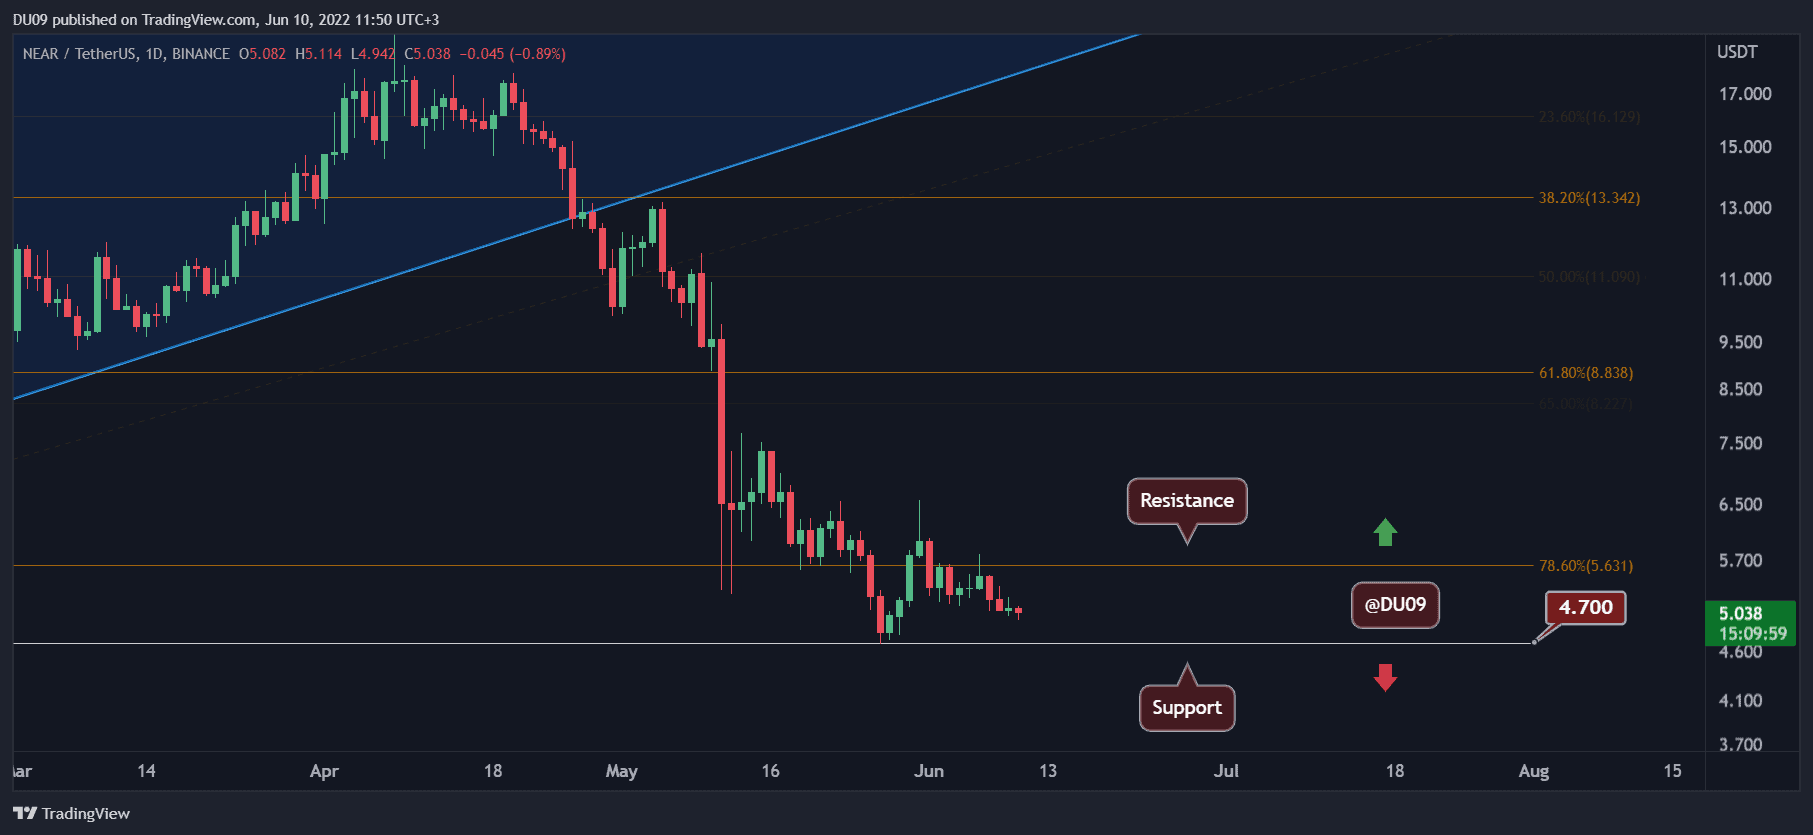
NEAR Protocol (NEAR)
After a significant correction since April, NEAR may have found a local bottom at $4.7. This key support level may be tested again since the price is found in a downtrend and has lost 11% of its value in the past seven days.
The key resistance is at $5.6, and bulls have failed to break this level in the past. Another attempt is likely if bears fail to push NEAR to form a lower low on this chart. Considering the price crashed by over 70% since April, it is likely that sellers may have become exhausted.
This opens an opportunity for buyers to attempt a strong recovery if the market turns bullish. Even if that does not materialize, so long as the bulls can keep NEAR in a flat trend, that is also a success as it will stop the correction that started in April.
Binance Free $100 (Exclusive): Use this link to register and receive $100 free and 10% off fees on Binance Futures first month (terms).
PrimeXBT Special Offer: Use this link to register & enter POTATO50 code to receive up to $7,000 on your deposits.
Disclaimer: Information found on CryptoPotato is those of writers quoted. It does not represent the opinions of CryptoPotato on whether to buy, sell, or hold any investments. You are advised to conduct your own research before making any investment decisions. Use provided information at your own risk. See Disclaimer for more information.
Cryptocurrency charts by TradingView.
Source: https://cryptopotato.com/crypto-price-analysis-june-10-ethereum-cardano-solana-chainlink-and-near-protocol/