Ethereum price analysis for today shows ETH prices have been on a downtrend over the past few hours as sellers have tightened their grip on the market. ETH/USD fell to lows of $1,544, recording a break below the previous support of $1,509 level. The price decline has been accelerated by the selling pressure from whales who are taking profit from their holdings. Additionally, the bearish sentiment in the cryptocurrency markets is also weighing on ETH prices as traders move to safer assets like Bitcoin and USDT.
This latest sell-off has seen Ethereum‘s price drop by 2.84 percent over the past 24 hours as the bears continue to dominate the market. Unless the bulls can push Ethereum’s prices above the $1578 resistance level, it is likely that ETH will remain in a bearish trend.
The trading volume of Ethereum has been dropping steadily since evening as traders await more clarity on the future of cryptocurrencies. Over the past few weeks, Ethereum has been on bullish momentum, but this could be short-lived if investors lack confidence in the digital asset.
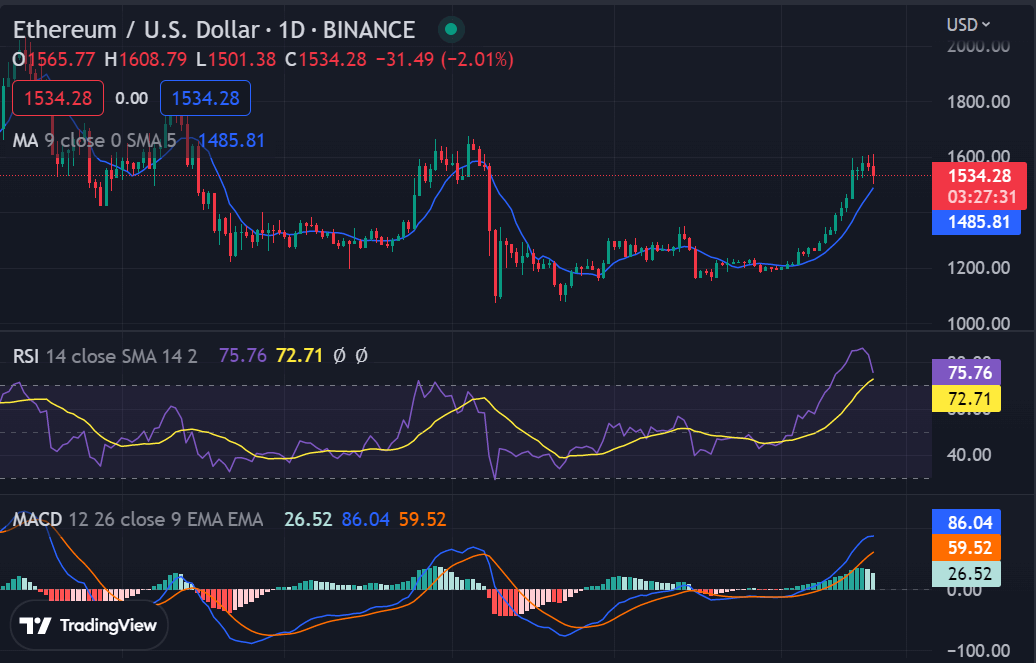
Ethereum price action on a 1-day price chart: Bears break below the ascending channel
On the 1-day price chart for Ethereum, we can see that ETH prices had been trading inside an ascending parallel channel early today as the buyers attempted to keep the market above the $1,509 support level. However, the sellers eventually broke below this channel andETH prices plummeted to lows of $1,544.
In order for Ethereum’s price action to turn bullish once again, ETH needs to reclaim the ascending parallel channel and push above the $1,602 resistance level. If Ethereum can break past this resistance level, then it might be able to reclaim the $1,620 region as buyers return to the market. However, if Ethereum fails to break above $1,620 in the next few hours, then it could continue its downward trend and fall back below the $1,500 mark. This could have disastrous consequences as Ethereum crashes right back to its yearly lows.

The technical indicators on the 24-hour chart are revealing a bearish momentum in the near term. The MACD is sloping down and the RSI is close to the oversold zone, suggesting that ETH could continue moving lower in the coming hours. The Stochastic oscillator is also in the bearish territory, indicating an increase in selling pressure over the next few days. The moving average (MA) is trading below the candles, indicating a bearish trend in Ethereum prices.
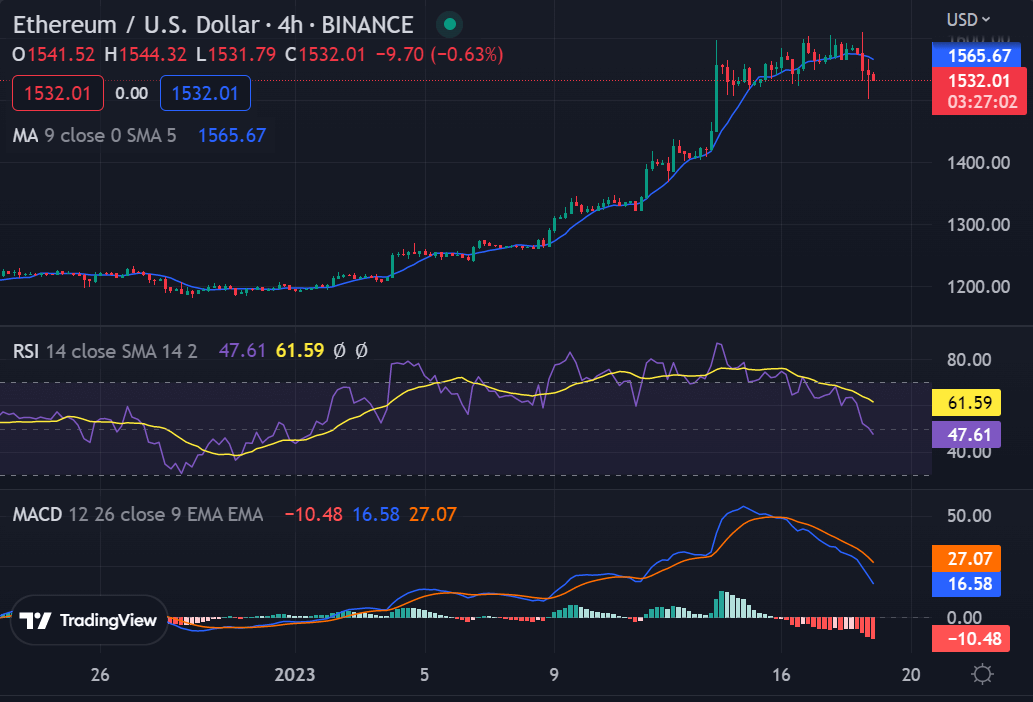
Ethereum price analysis on a 4-hour price chart: ETH prices sink to lows of $1,544
Ethereum price analysis on the 4-hour price chart shows that ETH/USD prices had been in a consolidation phase since the beginning of today. ETH has been trading in a range between the $1,509 and $1,602 resistance levels. However, today’s sell-off has caused ETH to sink below this range as prices have dropped to lows of $1,544.

The MACD and RSI values have both dropped into bearish territory, indicating that Ethereum’s price action could continue to decline in the near term. The Stochastic oscillator is also sloping down and pointing towards a further drop in ETH prices. The moving average (MA) is at a bearish cross, suggesting that Ethereum could remain in a downward trend.
Ethereum price analysis conclusion
Ethereum has seen a sharp decline in prices over the past few hours as sellers tighten their grip on the market. ETH/USD broke below the previous support of $1,509 and is now trading at lows of $1,544. The technical indicators are showing bearish signals which could indicate that Ethereum’s price action will remain bearish in the short term. Unless the bulls can push ETH above the $1,602 resistance level, Ethereum’s price could continue to decline in the coming days.
While waiting for Ethereum to move further, see our articles on how to buy Polkadot, Filecoin, and Shiba Inu.
Source: https://www.cryptopolitan.com/ethereum-price-analysis-2023-01-18/
